Fig. 9
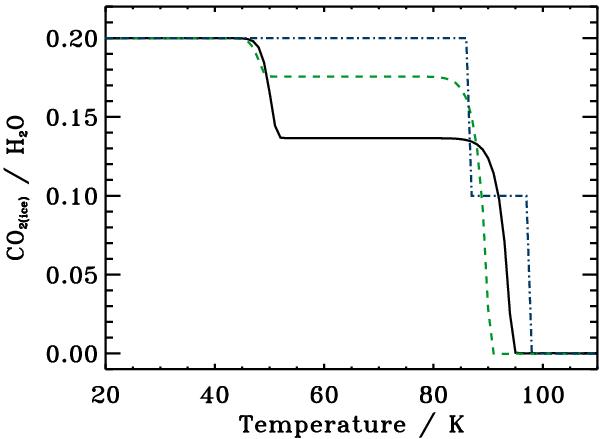
Amount of CO2 ice during ice warm-up for a H2O:CO2 5:1 ice 20 ML thick simulated by different models: the implemented three-phase model described here (black solid line), the original three-phase model by Hasegawa & Herbst (1993) (green dashed line), the Viti et al. (2004) model (blue dash-dotted line). A heating rate of 1 K per century is used in the two first models and desorption around a 5 solar masses protostar is presented from the Viti et al. (2004) model case.
Current usage metrics show cumulative count of Article Views (full-text article views including HTML views, PDF and ePub downloads, according to the available data) and Abstracts Views on Vision4Press platform.
Data correspond to usage on the plateform after 2015. The current usage metrics is available 48-96 hours after online publication and is updated daily on week days.
Initial download of the metrics may take a while.