Fig. 6
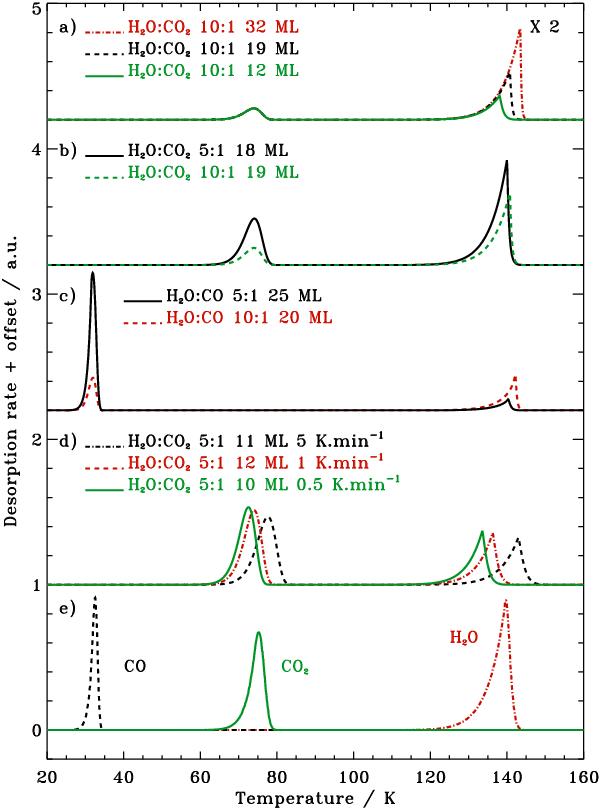
Simulated CO2 and CO TPD curves from H2O:CO2 and H2O:CO mixtures for different thicknesses, ratios, and heating rates a)–d). Panel e) presents the simulated desorption of pure H2O, CO2 and CO ice. This figure connects the model outputs to the experiments shown in Fig. 3.
Current usage metrics show cumulative count of Article Views (full-text article views including HTML views, PDF and ePub downloads, according to the available data) and Abstracts Views on Vision4Press platform.
Data correspond to usage on the plateform after 2015. The current usage metrics is available 48-96 hours after online publication and is updated daily on week days.
Initial download of the metrics may take a while.