Fig. 2
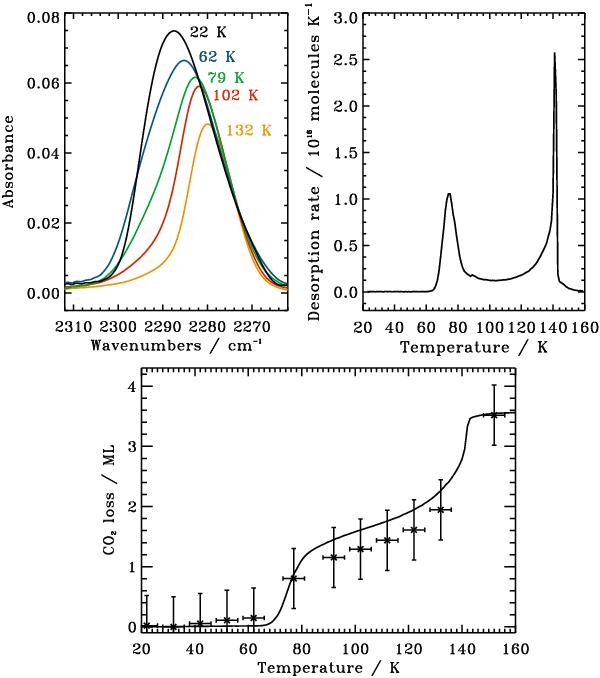
The upper left panel presents the infrared CO2 stretching features at specific temperatures during the warm-up of 18 ML of a H2O:CO2 5:1 ice heated at 1 K.min-1. The right upper panel presents the desorption rate of CO2 for the same experiment obtained by mass spectrometry. The bottom panel shows the ice loss for this experiment obtained by infrared measurements (crosses) and mass spectrometry (solid line).
Current usage metrics show cumulative count of Article Views (full-text article views including HTML views, PDF and ePub downloads, according to the available data) and Abstracts Views on Vision4Press platform.
Data correspond to usage on the plateform after 2015. The current usage metrics is available 48-96 hours after online publication and is updated daily on week days.
Initial download of the metrics may take a while.