Fig. 6
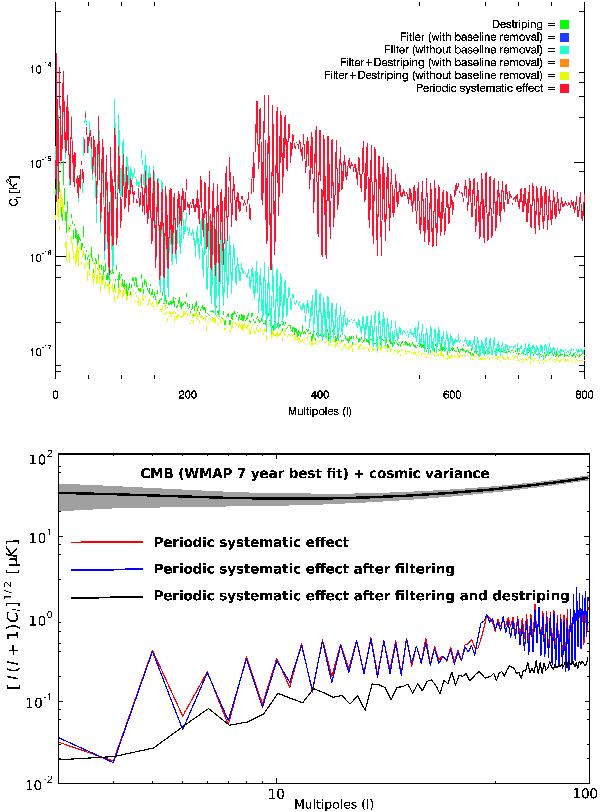
Top: power spectra the periodic systematic effect before (red curve) and after removal. Green: destriping only. Filtering without baseline removal – cyan: filtering only, yellow: filtering + destriping. Filtering with baseline removal – blue: filtering only, orange: filtering + destriping. Note that the yellow, orange, and blue curves are superimposed, meaning that the three cases produced the same results. Bottom: impact of periodic fluctuations on large scales compared to the CMB and cosmic variance obtained from a best-fit solution of the seven year WMAP data.
Current usage metrics show cumulative count of Article Views (full-text article views including HTML views, PDF and ePub downloads, according to the available data) and Abstracts Views on Vision4Press platform.
Data correspond to usage on the plateform after 2015. The current usage metrics is available 48-96 hours after online publication and is updated daily on week days.
Initial download of the metrics may take a while.