Fig. 5
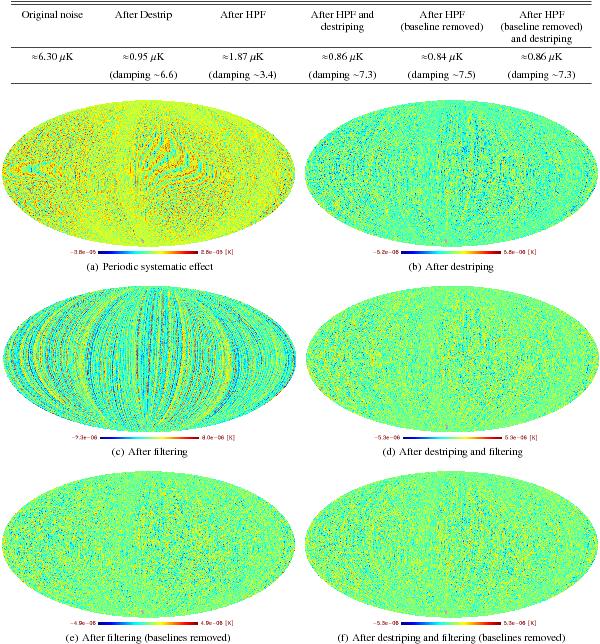
Maps of the periodic systematic effect before and after filtering-alone (with and without baseline removal), destriping-alone, and filtering + destriping. Colours are rescaled in every map to highlight footprints of any systematic effects. In the above table, we summarise the map rms values and the corresponding damping factors.
Current usage metrics show cumulative count of Article Views (full-text article views including HTML views, PDF and ePub downloads, according to the available data) and Abstracts Views on Vision4Press platform.
Data correspond to usage on the plateform after 2015. The current usage metrics is available 48-96 hours after online publication and is updated daily on week days.
Initial download of the metrics may take a while.