Fig. 4
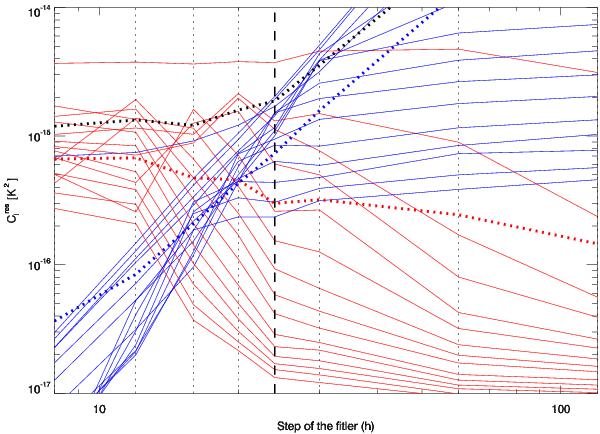
Residual  at various multipoles (ranging from 1 to 600 and averaged in groups of 40) as a function of the filter step, N. Red curves represent the residual after filtering a data-stream containing only the systematic effect, while blue curves show the residual obtained after filtering the astrophysical signal. Vertical dotted lines represent the tested values and black dashed line is the selected one. Horizontal coloured dotted lines are the mean of all 600 multipoles and the black line represents the sum of the red and blue dotted lines.
Current usage metrics show cumulative count of Article Views (full-text article views including HTML views, PDF and ePub downloads, according to the available data) and Abstracts Views on Vision4Press platform.
Data correspond to usage on the plateform after 2015. The current usage metrics is available 48-96 hours after online publication and is updated daily on week days.
Initial download of the metrics may take a while.