Fig. 3
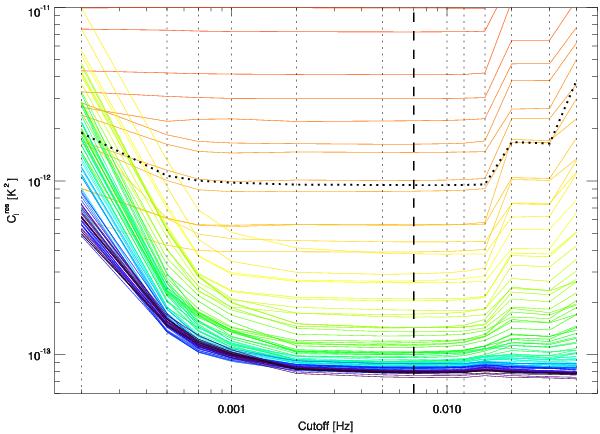
Residual  at multipoles ranging from 1 (red) to 500 (blue) as a function of the cut-off frequency fcut. Vertical dotted lines represent the values of fcut that have been tested and the black dashed line is the optimal one. The horizontal dotted line represents the mean of the 500 multipoles. In these runs, we have multiplied the amplitude of the periodic systematic effect by a factor 100 to enhance its effect.
Current usage metrics show cumulative count of Article Views (full-text article views including HTML views, PDF and ePub downloads, according to the available data) and Abstracts Views on Vision4Press platform.
Data correspond to usage on the plateform after 2015. The current usage metrics is available 48-96 hours after online publication and is updated daily on week days.
Initial download of the metrics may take a while.