Fig. 1
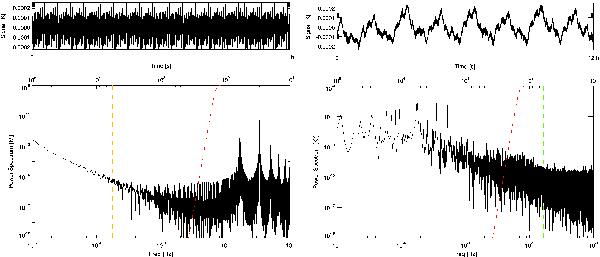
The astrophysical signal (left) and the periodic systematic effect (right) in the simulated data-streams. The top panels of the two figures present the signals in the time domain, while the bottom panels show their power spectra. The green line is located at the frequency of 1/60 Hz, while the two yellow lines indicate the two main frequencies of the periodic effect. The red dashed line shows the shape of the high-pass filter; the filter curve is not to scale, its true value on the y-axis ranges from 0 to 1.
Current usage metrics show cumulative count of Article Views (full-text article views including HTML views, PDF and ePub downloads, according to the available data) and Abstracts Views on Vision4Press platform.
Data correspond to usage on the plateform after 2015. The current usage metrics is available 48-96 hours after online publication and is updated daily on week days.
Initial download of the metrics may take a while.