Fig. 4
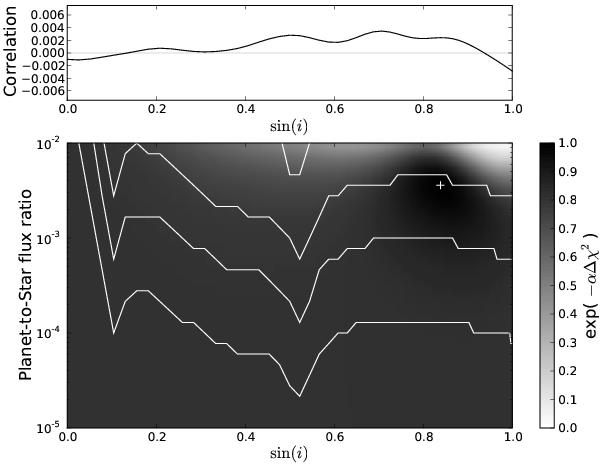
Top: correlation result for our data set as a function of sini. The correlation remains flat along every inclination without any distinctive peak, the maximum value is reached at sini = 0.71. Bottom: goodness of fit, χ2-map, of the correlation models to the data. The horizontal and vertical axes refer to the fitting parameters sini and Fp/Fs respectively, at which the synthetic planetary spectrum was added in the correlation models creation, from which we calculated the minimum squares ( ). We plot χ2 relative to the best fit (
 ) using the function exp(−αΔχ2). The gray scale denotes the goodness of fit, from black for the best fit (at
  ), to white for the poorest fit. The plotting parameter, α, just enables a good contrast in the plots (the same value was used for all plots). Additionally, we determined with bootstrap procedures the solid lines (bottom to top) that mark the (1, 2, 3 and 4-σ) levels of false-alarm probability. The white cross marks the best fit at sini = 0.84 and Fp/Fs = 3.6 × 10⁻³, situated below the 3-σ confidence level.
Current usage metrics show cumulative count of Article Views (full-text article views including HTML views, PDF and ePub downloads, according to the available data) and Abstracts Views on Vision4Press platform.
Data correspond to usage on the plateform after 2015. The current usage metrics is available 48-96 hours after online publication and is updated daily on week days.
Initial download of the metrics may take a while.