| Issue |
A&A
Volume 529, May 2011
|
|
|---|---|---|
| Article Number | A110 | |
| Number of page(s) | 7 | |
| Section | Extragalactic astronomy | |
| DOI | https://doi.org/10.1051/0004-6361/201015318 | |
| Published online | 13 April 2011 | |
GRB 071028B, a burst behind large amounts of dust in an unabsorbed galaxy
1
Max-Planck-Institut für extraterrestrische Physik, Giessenbachstraße 1, 85748 Garching, Germany
e-mail: This email address is being protected from spambots. You need JavaScript enabled to view it.
2
Universe Cluster, Technische Universität München, Boltzmannstraße 2, 85748 Garching, Germany
3
Thüringer Landessternwarte Tautenburg, Sternwarte 5, 07778 Tautenburg, Germany
4
European Southern Observatory, Karl-Schwarzschild-Straße 2, 85748 Garching, Germany
5
Department of Physics and Astronomy, Clemson University, Clemson, SC 29634-0978, USA
Received: 1 July 2010
Accepted: 12 January 2011
Abstract
Aims. We report on the discovery and properties of the fading afterglow and underlying host galaxy of GRB 071028B, thereby facilitating a detailed comparison between these two.
Methods. Observations were performed with the Gamma-ray Burst Optical and Near-infrared Detector at the 2.2 m telescope on the La Silla Paranal Observatory in Chile. We conducted five observations from 1.9 d to 227.2 d after the trigger and obtained deep images in the g′r′i′z′ and JHKs bands.
Results. Based on accurate seven-channel photometry covering the optical to near-infrared wavelength range, we derive a photometric redshift of  for the unabsorbed host galaxy of GRB 071028B. In contrast, we show that the afterglow with an intrinsic extinction of
  is moderately absorbed and requires a relatively flat extinction curve. According to the reported Swift/BAT observations, the energetics yield an isotropic energy release of
  .
.
Key words: x-rays: bursts / galaxies: starburst / galaxies: photometry / techniques: photometric
© ESO, 2011
1. Introduction
Swift is primarily designed for the rapid and precise localisation of gamma-ray bursts (GRBs) and their afterglow (Gehrels et al. 2004). Utilising the on-board Burst Alert Telescope (BAT) (Barthelmy et al. 2005), the satellite continuously surveys an area in the sky of about two steradians and reacts to increased gamma-ray emission. Once a GRB has been detected, Swift determines an initial position to a precision of about 3′ and autonomously slews to the new location within a few seconds. The X-ray Telescope (XRT) (Burrows et al. 2005), which is a second on-board instrument with a narrow field-of-view, now points towards the GRB, yielding a refined position measurement with an accuracy of about 3′′−5′′. Simultaneously, the on-board Ultraviolet and Optical Telescope (UVOT) (Roming et al. 2005) is utilised for further improvement of the GRB location. Swift thus provides an accurate position within a minute after the trigger and ground-based follow-up observations can be promptly initiated.
However, there are several factors that prevent the automated detection of GRBs by Swift: weak, short-, or very long-duration bursts, bursts located near the edge of the field-of-view, and bursts occurring shortly before or during a preplanned slew manoeuvre. Therefore, the data are routinely streamed to the ground and attempts are made by the Swift/BAT team to detect any missed GRBs. Before the late ground-based detection of GRB 071028B, only eight (3%) similar cases out of 277 GRBs detected by Swift had been known: GRB 051012 (Sato et al. 2005), GRB 051114 (Cummings et al. 2005), GRB 060505 (Palmer et al. 2006), GRB 070227 (Pagani et al. 2007), GRB 070326 (Copete et al. 2007), GRB 070406 (Cummings et al. 2007), GRB 071006 (Cummings 2007a), and GRB 071010C (Cummings 2007b). In these cases, the average time delay between the GRB and the reported localisation is 34 h.
Before we report on our observations performed with the Gamma-ray Burst Optical and Near-infrared Detector (GROND) and our analysis of the afterglow and host galaxy of GRB 071028B, we review the corresponding Swift observations.
2. Swift observations of GRB 071028B
GRB 071028B (trigger #295492) was observed by the Swift/BAT on October 28, 2007, at T0 = 02:43:46 UT. Since this GRB was located near the edge of the field-of-view, no source was immediately found on-board, so no prompt Swift/XRT and Swift/UVOT observations were performed. The late ground-based analysis of the Swift/BAT data revealed a source at the coordinates of α,δ (J2000.0) = 23h36m39s, −31°37′48′′ with an error radius of 3′, where this position was announced with a time delay of 58.6 h (Cummings & Greiner 2007).
Swift/XRT observations of GRB 071028B were scheduled and performed on October 30, 2007, at 13:36 UT (T0 + 2.5 d) for 14.1 ks, detecting one known X-ray source with a likely optical counterpart from the United States Naval Observatory (USNO) catalogue, and two rather faint, uncatalogued X-ray sources within the Swift/BAT error circle. No optical counterparts of the unknown X-ray sources were discovered with the Swift/UVOT to a 3σ upper limit of mV = 21.3 mag in a total of 6443 s exposure (Grupe & Schady 2007).
On November 7, 2007, at 00:02 UT (T0 + 9.9 d) and on November 10, 2007, at 06:44 UT (T0 + 13.2 d) follow-up observations were performed with the Swift/XRT for 9 ks and 11 ks, respectively. One of the two faint objects located at the coordinates of α,δ (J2000.0) = 23h36m39.s12, − 31°37′13.′′8 with an error radius of 4.′′8 had clearly faded below a 3σ upper limit of 6.7 × 10⁻⁴ cts s-1, indicating that this was the X-ray afterglow of GRB 071028B (Grupe 2007). Butler (2007) determines the astrometrically corrected Swift/XRT position of GRBs. As a result, the X-ray afterglow coordinates of GRB 071028B were revised to α,δ (J2000.0) = 23h36m38.s67, − 31°37′17.′′0 with an error radius of 3.′′4.
Swift/BAT observations of GRB 071028B in the 15 − 150 keV energy range yielded a light curve showing two fast rise and exponential decay (FRED) peaks at T0 + 1 s and T0 + 48 s with a duration of about 4 s and 9 s, respectively (Cummings & Greiner 2007). Integrating this light curve from T0 − 0.5 s and over a time interval of 1 s, Grupe et al. (2007) determined a peak photon flux of Φ = (1.4 ± 0.5) ph cm-2 s-1. This GRB released 90% of its total energy within a time period of T90 = (55 ± 2) s (Grupe et al. 2007), thereby falling into the class of long-duration bursts (Kouveliotou et al. 1993).
The Swift/XRT spectrum of GRB 071028B covering the 0.3 − 10 keV energy range can be described by a photon index of  (Evans et al. 2009) and an intrinsic hydrogen column density consistent with the Galactic value of NH = 1.2 × 1020 cm-2 (Kalberla et al. 2005).
All quoted errors deduced from Swift observations are at the 90% confidence level.
3. GROND observations of GRB 071028B
GROND is mounted at the 2.2 m telescope of the Max-Planck-Gesellschaft (MPG), which is operated by the European Southern Observatory (ESO) on the La Silla Paranal Observatory (LSPO) in Chile, and is capable of simultaneous optical and near-infrared imaging (Greiner et al. 2008). The instrument typically takes series of 46 s, 137 s, or 408 s integrations in the g′r′i′z′ bands with gaps of about 70 s. In parallel, the three near-infrared detectors (JHKs bands) perform 10 s integrations, which are separated by about 6 s. These unavoidable gaps are caused by read-out, data transfer, telescope presets, and dithering.
Observation log of GRB 071028B.
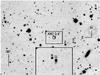 |
Fig. 1 Finding chart covering the 4′ × 3′ field of GRB 071028B as observed with GROND for 2.22 h in the r′ band during the first observing night. The circle represents the astrometrically corrected Swift/XRT position with its 90% error radius. All secondary standard stars used for the photometric calibration (see Table 2), the afterglow (A), and a putative foreground galaxy (G) are labelled. A scale-up of the afterglow area is shown in the bottom panel. |
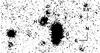 |
Fig. 2 Scale-up showing the suspected host galaxy (H) of GRB 071028B, a putative foreground galaxy (G), and a potential dwarf galaxy (D) as observed with GROND for 5.7 h in the r′ band. The small circle represents the position of the afterglow. Several images taken at T0 + 14.9 d and later are combined to maximise the signal-to-noise ratio. |
GROND observations of GRB 071028B could already be initiated at T0 + 45.7 h, since we received a private communication announcing a preliminary Swift/BAT position (Greiner 2007, priv. comm.). The log of all five observations is listed in Table 1. In addition, the finding chart is displayed in Fig. 1 and a scale-up of GRB 071028B and the surrounding area is shown in Fig. 2.
Apparent brightnesses (in the AB system) and errors for the secondary photometric standard stars of GRB 071028B.
4. Data reduction and analysis
The data reduction and analysis was done in a standard way by applying a bad pixel map, dark and bias frames, a flat-field and fringe correction (z′ band) to each raw image. We utilised the GROND Manual Analysis Pipeline v1.6 (Küpcü Yoldaş et al. 2008), which is mainly based on commands from the IRAF package (Tody 1993) and SExtractor (Bertin & Arnouts 1996).
All exposures of the first observing night within a single filter band were stacked to maximise the signal-to-noise ratio of the afterglow, yielding effective exposure times of 2.22 h and 1.73 h for the g′r′i′z′ and JHKs bands, respectively. We combined the corresponding frames of the second, third, and fifth observing night, obtaining deep images of the surrounding galaxies with effective exposure times of 5.71 h and 4.32 h for the g′r′i′z′ and JHKs bands, respectively. The images of the fourth observing night were excluded from the stacking, since they were taken under bad seeing conditions.
Separately for the photometry of the afterglow and the surrounding galaxies, the corresponding seven images were first aligned to the g′ band frame using five isolated stars to determine their relative shift, rotation and scale. The point-spread functions (PSFs) of these images were then matched to the worst PSF (Ks band), since the average seeing shows intolerable variations from 1.′′12 to 1.′′65 and 1.′′20 to 1.′′69 for the individual filter bands of both data sets, respectively.
Running SExtractor in Dual Mode and using the deepest image (r′ band) as the reference frame, the photometry was extracted by applying the same apertures, which were fixed in size and position, to the remaining images. The detection routine was set to recognise sources consisting of at least two pixels, which are 3σ above the background, and a minimum contrast parameter of 0.002 with 32 subthresholds for deblending.
Standard PSF photometry was applied to conduct the photometric calibration. GROND observed the field of GRB 071028B on June 15, 2008, at 08:45 UT (T0 + 231.3 d) for 2.4 min in the g′r′i′z′ bands and 4.0 min in the JHKs bands under photometric conditions and at low airmass. Shortly afterwards at 08:54 UT (T0 + 231.3 d), the nearby field of standard star SA 114-750 (Smith et al. 2002) was imaged for 12 s and 48 s, respectively. The latter observation allowed us to derive zero points for the g′r′i′z′ and JHKs bands by comparing catalogue stars from the Sloan Digital Sky Survey (SDSS) (Abazajian et al. 2009) and the Two Micron All Sky Survey (2MASS) (Skrutskie et al. 2006) with SA 114-750 field stars. Subsequently, bright stars with well-sampled PSFs in all seven filter bands were chosen as close as possible to GRB 071028B. Based on the calibrated zero points, their magnitudes were then transformed to the AB system (Oke & Gunn 1983). In this way, a set of five secondary photometric standard stars for relative photometry was established (see Table 2). The photometry of the afterglow and the surrounding galaxies was corrected assuming a Galactic extinction of AV = 0.06 mag (Schlegel et al. 1998). The astrometry was obtained by matching the positions of field stars in r′ band frames with their coordinates listed in the USNO catalogue (Monet et al. 2003). Including the statistical error of the astrometric solution, the overall precision is approximately 0.′′3.
We have adopted a flat Λ-dominated universe with a normalised cosmological constant of ΩΛ = 0.73, a matter density of Ωm = 0.27 and a Hubble constant of H0 = 71 km s-1 Mpc-1 throughout the paper (Spergel et al. 2003). Cosmological parameters (e.g. angular scale) were computed using the Cosmology Calculator coded by Wright (2006). The properties of the afterglow and the surrounding galaxies (e.g. absolute brightness) were estimated using HyperZ v11 originally developed by Bolzonella et al. (2000). The analysis of the broad-band spectral energy distribution (SED) was done using the numerical minimisation program Minuit (James & Roos 1975), which is included in the software package ROOT v5.27.06 (Brun & Rademakers 1997) and was modified to fit the needs of GRB afterglow physics. All errors estimated with HyperZ and Minuit are given at the 1σ confidence level.
5. Results and discussion of GRB 071028B
In the images of the first observing night, a single point source (A) was detected at the coordinates of α,δ (J2000.0) = 23h36m38.s83, − 31°37′13.′′3 with an uncertainty of 0.′′3. This is within the original Swift/XRT error circle (Grupe 2007), but just outside of the error circle determined by Butler (2007). The point source had also clearly faded in later images, indicating that this was the optical and near-infrared afterglow of GRB 071028B (see Sect. 5.3).
Starting with the second observing night at T0 + 14.9 d, an extended object (H) next to the afterglow position was clearly detected in the images. Based on an angular scale of 7.9 kpc/′′ derived from a photometric redshift of for this constant source, the angular offset of  between the afterglow and this object corresponds to a projected distance of
  . This is twice as large as the median projected distance of 1.3 kpc found by Bloom et al. (2002) for a sample of 20 hosts of long-duration GRBs, but fully consistent within the errors. We therefore interpret this object as the host galaxy of GRB 071028B, which is centred on the coordinates of α,δ (J2000.0) = 23h36m38.s81, − 31°37′13.′′1 with an error of 0.′′3 (see Sect. 5.1).
Southwest of the afterglow position, there is a prominent and extended object (G) located at the central coordinates of α,δ (J2000.0) = 23h36m38.s49, − 31°37′16.′′1 with an uncertainty of 0.′′3. The angular offset of 6.′′4 ± 0.′′4 between the afterglow and this constant source at a photometric redshift of  corresponds to a projected distance of (41 ± 2) kpc. Since this is 31 times larger than the median projected distance of GRB hosts, we conclude that this object is not associated with GRB 071028B and instead represents a foreground galaxy (see Sect. 5.2).
The extended object (D) northwest of the afterglow position is centred on the coordinates of α,δ (J2000.0) = 23h36m38.s70, − 31°37′10.′′5 with an error of 0.′′3. We now assume that this object represents a host galaxy at an unknown redshift z. In this way, we estimate a lower limit of z ≈ 0.7 by adopting the lowest redshift in the sample of hosts of long-duration GRBs, which are fainter than this constant source with an apparent brightness of mr′ ≈ 24.4 mag (Savaglio et al. 2009). We then calculate a minimum projected distance of 24 kpc between the afterglow and this object, thus making an association of this source with GRB 071028B very implausible. Given the detection in only g′ and r′ band images, we suppose this is a very blue and young dwarf galaxy.
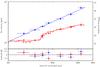 |
Fig. 3 Optical and near-infrared spectral energy distributions of the afterglow (top) taken on October 30, 2007, at 01:50 UT (T0 + 2.0 d) and host galaxy (bottom) of GRB 071028B. Using HyperZ, the data points are best fit by a single power law with a spectral index of |

Apparent brightnesses (in the AB system) and errors for the afterglow (A) and host galaxy (H) of GRB 071028B.
5.1. Properties of the host galaxy
The photometry of the host galaxy (H) yields the apparent brightnesses presented in Table 3 and Fig. 3.
We utilised HyperZ for fitting the model of a starburst (SB), as well as models of elliptical (E), irregular (I), and spiral (Sx) galaxies to the optical and near-infrared SED of the host galaxy (Bruzual & Charlot 2003). Besides the simplest case of an unabsorbed host galaxy, we examined scenarios based on dust models of the Milky Way (MW) (Seaton 1979), the Large Magellanic Cloud (LMC) (Fitzpatrick 1986), the Small Magellanic Cloud (SMC) (Prevot et al. 1984; Bouchet et al. 1985), and a starburst (SB) (Calzetti et al. 2000). These MW, LMC, and SMC extinction laws are strictly valid for individual lines-of-sight, whereas the SB attenuation law, which is likely to be associated with the SMC extinction law, considers scattering and propagation in extended objects.
During the fitting, we limited the photometric redshift z of the host galaxy to a parameter range of 0.02 ≤ z ≤ 1.20 (steps of 0.01), since no GRB host with apparent brightnesses of mR ≤ 23.9 mag and mK ≤ 23.3 mag is known at a redshift of z ≥ 1.2 (Savaglio et al. 2009). Moreover, the clearly detected emission of the afterglow in the g′ band signifies that the Lyman break is lying bluewards of the shortest filter band, implying a redshift of z ≤ 3.3. The age τ of the dominant stellar population was allowed to vary between a minimum value of 1.0 Myr and the age of the Universe at the fitted redshift. A wide parameter range of 0.00 mag ≤ AV ≤ 1.60 mag (steps of 0.04 mag) was allowed for the intrinsic extinction AV.
Results for the host galaxy of GRB 071028B.
Table 4 shows the simplest scenarios without dust in the host galaxy, where the scenarios based on the model of an elliptical galaxy, an irregular galaxy, or a starburst are implausible. In contrast, the best-fit solution with a goodness-of-fit of χ2/d.o.f. = 3.54/4 is based on the model of an Sb galaxy, but it is impossible to distinguish this model from those of other spiral galaxies. We also note that these good-fit solutions yield comparable redshifts of z ≈ 0.94. Applying dust models and thereby introducing the intrinsic extinction AV as an additional free parameter does not significantly improve the fits, since fitting these scenarios shows only marginally better χ2-statistics (χ2/d.o.f. ≥ 2.91/3). Moreover, similar results to the scenarios without dust are obtained in this way. We therefore adopt a photometric redshift of and an age τ of the dominant stellar population between 2.3 Gyr and 8.5 Gyr for the host galaxy.
Assuming that the prominent colour-term of mr′ − mi′ ≈ 0.6 mag between the r′ and i′ bands indicates the position of both the Balmer break and the Ca II H&K doublet, we independently estimate a redshift of z ≈ 0.9, which is consistent with the photometric value. The estimated apparent brightnesses of mr′ = (23.60 ± 0.09) mag and mKs = (21.70 ± 0.14) mag for the host galaxy, as well as its absolute brightness of MK ≈ − 21.5 mag are not exceptional, and agree with the sample of GRB hosts compiled by Savaglio et al. (2009).
Savaglio et al. (2009) have mainly studied GRB hosts at a redshift of z ≤ 1.6, and establish the following correlation between the stellar mass M∗ and the dust-corrected absolute brightness MK (in the AB system):
 where this formula is valid provided that the Balmer break is located bluewards of the K band. We note that the stellar mass M∗ is subject to a minimum dispersion of roughly a factor of two. By applying the absolute brightness of MK ≈ − 21.5 mag to the equation above, we calculate a stellar mass of M∗ ≈ 7.0 × 10⁹ M⊙ for the host galaxy. This agrees with the stellar mass of M∗ ≈ 31 × 109 M⊙ derived from the model fitting, since both procedures are affected by a large uncertainty. We therefore conclude that the host galaxy belongs to the category of dwarf galaxies. In comparison, we derive a lower median stellar mass of about 2.0 × 10⁹ M⊙ for hosts of long-duration GRBs from the results provided by Savaglio et al. (2009).
5.2. Properties of the foreground galaxy
We assume for the photometry of the foreground galaxy (G) that the clearly visible bulge and the extended structure south of it constitute a single irregular galaxy. In this way, we estimate the apparent brightnesses presented in Table 3.
We applied the same methods as already used for analysing the host galaxy SED on the optical and near-infrared SED of the foreground galaxy, and calculate a minimum goodness-of-fit of χ2/d.o.f. ≥ 4.00/4 for the scenarios without dust. In contrast, the best-fit solution with a superior goodness-of-fit of χ2/d.o.f. = 0.668/3 is obtained by applying dust models. According to the theorem of Wilks (1938), this improvement of Δχ2 = 3.33 justifies introducing the intrinsic extinction AV as an additional free parameter with a probability of 93%. In this way, the best-fit solution yields a photometric redshift of for the foreground galaxy consistent with the photometric redshift z of the scenarios without dust.
This lower redshift compared to the host galaxy is also demonstrated by both the prominent Balmer break and the Ca II H&K doublet between the g′ and r′ bands (mg′ − mr′ ≈ 1.1 mag).
5.3. Properties of the afterglow
The photometry of the afterglow (A) is obtained by eliminating the coexistent emission of the host galaxy, since the latter contributes up to 32% (g′ band) to the entire light. We therefore subtract the total fluxes of the host galaxy from the corresponding total fluxes of the afterglow, and propagate the errors accordingly. This approach is preferred to the extraction of the afterglow photometry from a residual image since the uncertainty of the recovered afterglow flux is minimised. In this way, we secure an unbiased photometry of the afterglow and estimate the apparent brightnesses presented in Table 3 and Fig. 3.
Utilising a modified version of HyperZ, we fitted a single power law to the optical and near-infrared SED of the afterglow. Besides the simplest case of an unabsorbed afterglow, we examined scenarios based on the same dust models as already used for analysing the host galaxy SED.
During the fitting, we fixed the redshift z of the afterglow to the photometric redshift z of the host galaxy (z = 0.94), since the latter is already known from an independent fit. We further limited the spectral index βO and the intrinsic extinction AV to a parameter range of 0.00 ≤ βO ≤ 2.20 (steps of 0.01) and 0.00 mag ≤ AV ≤ 1.60 mag (steps of 0.04 mag), respectively.
Results for the afterglow of GRB 071028B.
Table 5 shows the details of the fits. For the simplest scenario without dust in the afterglow, the best-fit solution reaches a goodness-of-fit of χ2/d.o.f. = 4.87/5. Moreover, the remaining scenarios based on dust models are best fit with equal χ2-statistics and identical results compared to the scenario without dust. We therefore note that the respective dust models cannot be distinguished. In this way, the best-fit solution yields a spectral index of  for the afterglow.
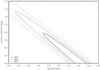 |
Fig. 4 Contour plot of the afterglow of GRB 071028B obtained by fitting models to its optical and near-infrared spectral energy distribution using HyperZ. The figure shows the 68%, 90%, and 99% confidence levels of the spectral index |


However, the spectral index  is much higher than expected from the Swift/XRT observations of GRBs studied by Evans et al. (2009) and the theoretical synchrotron spectra of their afterglows (Sari et al. 1998). This discrepancy strongly indicates an absorbed afterglow, but no local dust model fits the data. There is no evidence of the 2175 Å graphite bump, which would be located in the g′ band based on the fixed redshift z of the afterglow, excluding the MW and LMC dust models. The SMC dust model in contrast features a strong ultraviolet extinction, which is not implied by the afterglow SED either. Thus, a specific dust model without strong features or curvature similar to the model of an SB is required in this case. These considerations are strengthened by the contour plot shown in Fig. 4, which signifies that an acceptable spectral index of
  can be obtained by a moderate to high intrinsic extinction of
  within the 68% confidence level.
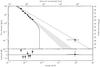 |
Fig. 5 Broad-band spectral energy distribution of the afterglow of GRB 071028B including GROND and Swift/XRT data points. Based on the dust model of a starburst (SB), the shaded area represents the extrapolation of the optical and near-infrared data points with the best-fit spectral index of |
The broad-band SED of the afterglow including GROND and Swift/XRT data points is shown in Fig. 5. Here, the X-ray data point taken at T0 + 2.7 d is extrapolated backwards to the time of the GROND observations, assuming a normal-decay phase with a mean temporal index of αX = 1.2 ± 0.2 (Evans et al. 2009). The systematic uncertainty of the backward extrapolation, based on the maximum and minimum values of αX, is added quadratically to the statistical measurement error of the X-ray data point. This approach is preferred to the forward extrapolation of the optical and near-infrared SED, since no strong spectral evolution is expected from late X-ray observations.
Shown in Fig. 5 is the extrapolation of the optical and near-infrared SED with the best-fit spectral index of  and without dust, which significantly underpredicts the X-ray data point. It is unlikely that strong flaring activity causes this excess in the X-ray flux, since only seven (2%) out of 287 GRBs detected by Swift until the end of December 2007 exhibit late flares from 104 s after the trigger (Curran et al. 2008). In this sample, the X-ray flares of only two (<1%) GRBs show a strong relative flux variability of ΔF/F ≳ 10, and the maximum value of ΔF/F ≈ 70 ± 40 is estimated for GRB 050916. Assuming an equally strong flare for GRB 071028B, the extrapolation of the optical and near-infrared SED would still underpredict the X-ray data point by a factor of about three. These findings also indicate that the afterglow is absorbed by significant amounts of dust.
We therefore utilised Minuit for fitting a single power law in combination with the dust model of an SB to the broad-band SED of the afterglow. Shown in Fig. 5 is the best-fit solution with a goodness-of-fit of χ2/d.o.f. = 6.86/5, which yields a spectral index of  and an intrinsic extinction of for the afterglow.
GROND systematically observed 128 GRBs from GRB 070802 to the end of March 2010 (Greiner et al. 2010). Thirty-nine long-duration GRBs out of this sample were observed less than 4 hr after the trigger, and they exhibit an afterglow detected by Swift/XRT. In the majority of these cases and for the first time, the intrinsic extinction AV of each afterglow was properly derived from a direct measurement of the respective optical and near-infrared SED. These findings indicate that the afterglow of GRB 071028B is not exceptional, but among the most absorbed 12% out of 33 long-duration GRBs with well known intrinsic extinctions.
While there has been evidence of a number of highly absorbed afterglows in recent years (e.g. Jaunsen et al. 2008; Krühler et al. 2008; Tanvir et al. 2008; Prochaska et al. 2009), GRB 071028B is special thanks to the relatively flat extinction curve. The only other GRB so far with clear evidence of a flat extinction curve is GRB 020813 (Savaglio & Fall 2004).
5.4. The energetics
GRB 071028B was observed by the Swift/BAT in the energy range of 15−150 keV, and the resulting prompt emission spectrum can be described well by a single power law with a photon index of Γ = 1.45 ± 0.25 (Grupe et al. 2007). Applying this to the equation of Sakamoto et al. (2009), we calculate a value of  for the peak energy of the Band function (Band et al. 1993). We note that the error estimate includes both the 1σ confidence level of the relation and the 90% uncertainty of the photon index. The normalisation parameter A of the Band function is based on an energy fluence of ϕ = (2.5 ± 0.8) × 10-7 erg cm-2, which is deduced from Swift/BAT observations (Grupe et al. 2007). Completing the set of spectral parameters, we use α = −Γ and assume a standard value of β = −2.5 for the low and high energy index of the Band function, respectively (Preece et al. 2000).
We now adopt the energy range of 1 keV − 10 MeV and apply the previously defined spectral parameters of α, β, and Ep to the normalised Band function of the observer’s frame. By integrating this over the blue-shifted energy range, an isotropic energy release of in the rest frame is calculated. We note that the error estimate is based on the maximum and minimum value of each spectral parameter and the redshift.
In comparison, Kocevski & Butler (2008) have studied the isotropic energy release of 63 long-duration GRBs detected by Swift, and derive a median value of roughly  . Hence, GRB 071028B is approximately 30 times less energetic than this median of the GRBs with known redshifts, and is among the lowest 8% of this sample.
6. Summary and conclusions
GRB 071028B was observed by the Swift/BAT, but no automated localisation was possible since this GRB was located near the edge of the field-of-view. Despite a late ground-based detection, we discovered the clearly fading afterglow with GROND. Our follow-up observations revealed a constant and extended source next to the afterglow position, which we identified as the underlying host galaxy.
Based on accurate seven-channel photometry covering the optical to near-infrared wavelength range, we placed constraints on the characteristics of the afterglow and host galaxy. Although previous studies have shown relatively low amounts of dust in GRB environments, the afterglow of GRB 071028B is moderately absorbed and requires a relatively flat extinction curve. In contrast, there is no evidence that the host galaxy is absorbed. These results indicate that the dust is local to the GRB environment or highly unevenly distributed within the host galaxy, a conclusion already drawn for a few other GRB lines-of-sight (Perley et al. 2009). We discussed the energetics further and concluded that this GRB is among the lowest 8% (Kocevski & Butler 2008). Observationally, the afterglow of GRB 071028B at T0 + 2.0 d is of comparable brightness to the afterglows in the incomplete sample of 50 long-duration GRBs detected by Swift until May 2009 and studied by Kann et al. (2010). Accounting for the observational bias and assuming that this sample is reasonably complete at the bright end of the distribution, the afterglow of GRB 071028B would be among the optically brightest 9% out of 370 GRBs with X-ray afterglows detected by Swift until May 2009. It also has a similar brightness to the afterglows of all GRBs detected by Fermi/LAT (McBreen et al. 2010).
Acknowledgments
We thank the referee for very helpful comments that allowed us to significantly improve the quality of the paper. T. Krühler acknowledges support by the Deutsche Forschungsgemeinschaft (DFG) cluster of excellence “Origin and Structure of the Universe”. S. Savaglio acknowledges support through project M.FE.A.Ext00003 of the MPG. The Ph.D. studies of F. Olivares E. are funded by the Deutscher Akademischer Austausch Dienst (DAAD). P. Schady acknowledges support through project SA 2001/2-1 of the DFG. S. Klose and A. Rossi acknowledge support by the DFG through grant Kl 766/11-3. A. C. Updike appreciates travel support through the Max-Planck-Institut für extraterrestrische Physik (MPE). Part of the funding for GROND (for both hardware and personnel) was granted from the Leibniz-Prize to Prof. G. Hasinger (DFG grant HA 1850/28-1). This work made use of data supplied by the United Kingdom Swift Science Data Centre at the University of Leicester.
References
- Abazajian, K. N., Adelman-McCarthy, J. K., Agüeros, M. A., et al. 2009, ApJS, 182, 543 [NASA ADS] [CrossRef] [Google Scholar]
- Band, D., Matteson, J., Ford, L., et al. 1993, ApJ, 413, 281 [NASA ADS] [CrossRef] [Google Scholar]
- Barthelmy, S. D., Barbier, L. M., Cummings, J. R., et al. 2005, Space Sci. Rev., 120, 143 [NASA ADS] [CrossRef] [Google Scholar]
- Bertin, E., & Arnouts, S. 1996, A&AS, 117, 393 [NASA ADS] [CrossRef] [EDP Sciences] [Google Scholar]
- Bloom, J. S., Kulkarni, S. R., & Djorgovski, S. G. 2002, AJ, 123, 1111 [NASA ADS] [CrossRef] [Google Scholar]
- Bolzonella, M., Miralles, J.-M., & Pelló, R. 2000, A&A, 363, 476 [NASA ADS] [Google Scholar]
- Bouchet, P., Lequeux, J., Maurice, E., Prevot, L., & Prevot-Burnichon, M. L. 1985, A&A, 149, 330 [NASA ADS] [Google Scholar]
- Brun, R., & Rademakers, F. 1997, Nucl. Inst. Meth. in Phys. Res. A, 389, 81 [CrossRef] [Google Scholar]
- Bruzual, G., & Charlot, S. 2003, MNRAS, 344, 1000 [NASA ADS] [CrossRef] [Google Scholar]
- Burrows, D. N., Hill, J. E., Nousek, J. A., et al. 2005, Space Sci. Revi., 120, 165 [Google Scholar]
- Butler, N. R. 2007, AJ, 133, 1027 [NASA ADS] [CrossRef] [Google Scholar]
- Calzetti, D., Armus, L., Bohlin, R. C., et al. 2000, ApJ, 533, 682 [NASA ADS] [CrossRef] [Google Scholar]
- Copete, A., Grindlay, J., Hong, J., Barthelmy, S., & Gehrels, N. 2007, GRB Coordinates Network, 6653, 1 [NASA ADS] [Google Scholar]
- Cummings, J. R. 2007a, GRB Coordinates Network, 6858, 1 [NASA ADS] [Google Scholar]
- Cummings, J. R. 2007b, GRB Coordinates Network, 6906, 1 [NASA ADS] [Google Scholar]
- Cummings, J. R., & Greiner, J. 2007, GRB Coordinates Network, 7019, 1 [NASA ADS] [Google Scholar]
- Cummings, J., Barthelmy, S., Gehrels, N., & Palmer, D. 2005, GRB Coordinates Network, 4272, 1 [NASA ADS] [Google Scholar]
- Cummings, J. R., Kennea, J. A., Landsman, W. B., et al. 2007, GRB Coordinates Network, 6247, 1 [NASA ADS] [Google Scholar]
- Curran, P. A., Starling, R. L. C., O’Brien, P. T., et al. 2008, A&A, 487, 533 [NASA ADS] [CrossRef] [EDP Sciences] [Google Scholar]
- Evans, P. A., Beardmore, A. P., Page, K. L., et al. 2009, MNRAS, 397, 1177 [NASA ADS] [CrossRef] [Google Scholar]
- Fitzpatrick, E. L. 1986, AJ, 92, 1068 [NASA ADS] [CrossRef] [Google Scholar]
- Gehrels, N., Chincarini, G., Giommi, P., et al. 2004, ApJ, 611, 1005 [NASA ADS] [CrossRef] [Google Scholar]
- Greiner, J., Bornemann, W., Clemens, C., et al. 2008, PASP, 120, 405 [NASA ADS] [CrossRef] [Google Scholar]
- Greiner, J., Krühler, T., Klose, S., et al. 2010, in Am. Inst. Phys. Conf. Ser., ed. N. Kawai, & S. Nagataki, 1279, 144 [Google Scholar]
- Grupe, D. 2007, GRB Coordinates Network, 7064, 1 [NASA ADS] [Google Scholar]
- Grupe, D., & Schady, P. 2007, GRB Coordinates Network, 7040, 1 [NASA ADS] [Google Scholar]
- Grupe, D., Cummings, J. R., Schady, P., et al. 2007, GCN Report, 105, 1 [NASA ADS] [Google Scholar]
- James, F., & Roos, M. 1975, Comp. Phys. Comm., 10, 343 [NASA ADS] [CrossRef] [Google Scholar]
- Jaunsen, A. O., Rol, E., Watson, D. J., et al. 2008, ApJ, 681, 453 [NASA ADS] [CrossRef] [Google Scholar]
- Kalberla, P. M. W., Burton, W. B., Hartmann, D., et al. 2005, A&A, 440, 775 [NASA ADS] [CrossRef] [EDP Sciences] [Google Scholar]
- Kann, D. A., Klose, S., Zhang, B., et al. 2010, ApJ, 720, 1513 [NASA ADS] [CrossRef] [Google Scholar]
- Kocevski, D., & Butler, N. 2008, ApJ, 680, 531 [NASA ADS] [CrossRef] [Google Scholar]
- Kouveliotou, C., Meegan, C. A., Fishman, G. J., et al. 1993, ApJ, 413, L101 [NASA ADS] [CrossRef] [Google Scholar]
- Krühler, T., Küpcü Yoldaş, A., Greiner, J., et al. 2008, ApJ, 685, 376 [NASA ADS] [CrossRef] [Google Scholar]
- Küpcü Yoldaş, A., Krühler, T., Greiner, J., et al. 2008, in Am. Inst. Phys. Conf. Ser., ed. M. Galassi, D. Palmer, & E. Fenimore, 1000, 227 [Google Scholar]
- McBreen, S., Krühler, T., Rau, A., et al. 2010, A&A, 516, A71 [NASA ADS] [CrossRef] [EDP Sciences] [Google Scholar]
- Monet, D. G., Levine, S. E., Canzian, B., et al. 2003, AJ, 125, 984 [NASA ADS] [CrossRef] [Google Scholar]
- Oke, J. B., & Gunn, J. E. 1983, ApJ, 266, 713 [NASA ADS] [CrossRef] [Google Scholar]
- Pagani, C., Chester, M. M., Cummings, J. R., et al. 2007, GRB Coordinates Network, 6156, 1 [NASA ADS] [Google Scholar]
- Palmer, D., Cummings, J., Stamatikos, M., Markwardt, C., & Sakamoto, T. 2006, GRB Coordinates Network, 5076, 1 [NASA ADS] [Google Scholar]
- Perley, D. A., Cenko, S. B., Bloom, J. S., et al. 2009, AJ, 138, 1690 [NASA ADS] [CrossRef] [Google Scholar]
- Preece, R. D., Briggs, M. S., Mallozzi, R. S., et al. 2000, ApJS, 126, 19 [NASA ADS] [CrossRef] [Google Scholar]
- Prevot, M. L., Lequeux, J., Prevot, L., Maurice, E., & Rocca-Volmerange, B. 1984, A&A, 132, 389 [NASA ADS] [Google Scholar]
- Prochaska, J. X., Sheffer, Y., Perley, D. A., et al. 2009, ApJ, 691, L27 [NASA ADS] [CrossRef] [Google Scholar]
- Roming, P. W. A., Kennedy, T. E., Mason, K. O., et al. 2005, Space Sci. Rev., 120, 95 [NASA ADS] [CrossRef] [Google Scholar]
- Sakamoto, T., Sato, G., Barbier, L., et al. 2009, ApJ, 693, 922 [NASA ADS] [CrossRef] [Google Scholar]
- Sari, R., Piran, T., & Narayan, R. 1998, ApJ, 497, L17 [NASA ADS] [CrossRef] [Google Scholar]
- Sato, G., Barbier, L., Barthelmy, S., et al. 2005, GRB Coordinates Network, 4093, 1 [NASA ADS] [Google Scholar]
- Savaglio, S., & Fall, S. M. 2004, ApJ, 614, 293 [NASA ADS] [CrossRef] [Google Scholar]
- Savaglio, S., Glazebrook, K., & LeBorgne, D. 2009, ApJ, 691, 182 [NASA ADS] [CrossRef] [MathSciNet] [Google Scholar]
- Schlegel, D. J., Finkbeiner, D. P., & Davis, M. 1998, ApJ, 500, 525 [NASA ADS] [CrossRef] [Google Scholar]
- Seaton, M. J. 1979, MNRAS, 187, 73P [NASA ADS] [CrossRef] [Google Scholar]
- Skrutskie, M. F., Cutri, R. M., Stiening, R., et al. 2006, AJ, 131, 1163 [NASA ADS] [CrossRef] [Google Scholar]
- Smith, J. A., Tucker, D. L., Kent, S., et al. 2002, AJ, 123, 2121 [Google Scholar]
- Spergel, D. N., Verde, L., Peiris, H. V., et al. 2003, ApJS, 148, 175 [NASA ADS] [CrossRef] [Google Scholar]
- Tanvir, N. R., Levan, A. J., Rol, E., et al. 2008, MNRAS, 388, 1743 [NASA ADS] [CrossRef] [Google Scholar]
- Tody, D. 1993, in Astronomical Data Analysis Software and Systems II, ed. R. J. Hanisch, R. J. V. Brissenden, & J. Barnes, Conf. Ser., 52, 173 [Google Scholar]
- Wilks, S. S. 1938, Ann. Math. Stat., 9, 60 [Google Scholar]
- Wright, E. L. 2006, PASP, 118, 1711 [NASA ADS] [CrossRef] [Google Scholar]
All Tables
Apparent brightnesses (in the AB system) and errors for the secondary photometric standard stars of GRB 071028B.
Apparent brightnesses (in the AB system) and errors for the afterglow (A) and host galaxy (H) of GRB 071028B.
All Figures
|
Fig. 1 Finding chart covering the 4′ × 3′ field of GRB 071028B as observed with GROND for 2.22 h in the r′ band during the first observing night. The circle represents the astrometrically corrected Swift/XRT position with its 90% error radius. All secondary standard stars used for the photometric calibration (see Table 2), the afterglow (A), and a putative foreground galaxy (G) are labelled. A scale-up of the afterglow area is shown in the bottom panel. |
| In the text | |
|
Fig. 2 Scale-up showing the suspected host galaxy (H) of GRB 071028B, a putative foreground galaxy (G), and a potential dwarf galaxy (D) as observed with GROND for 5.7 h in the r′ band. The small circle represents the position of the afterglow. Several images taken at T0 + 14.9 d and later are combined to maximise the signal-to-noise ratio. |
| In the text | |
|
Fig. 3 Optical and near-infrared spectral energy distributions of the afterglow (top) taken on October 30, 2007, at 01:50 UT (T0 + 2.0 d) and host galaxy (bottom) of GRB 071028B. Using HyperZ, the data points are best fit by a single power law with a spectral index of |
| In the text | |
|
Fig. 4 Contour plot of the afterglow of GRB 071028B obtained by fitting models to its optical and near-infrared spectral energy distribution using HyperZ. The figure shows the 68%, 90%, and 99% confidence levels of the spectral index |
| In the text | |
|
Fig. 5 Broad-band spectral energy distribution of the afterglow of GRB 071028B including GROND and Swift/XRT data points. Based on the dust model of a starburst (SB), the shaded area represents the extrapolation of the optical and near-infrared data points with the best-fit spectral index of |
| In the text | |
Current usage metrics show cumulative count of Article Views (full-text article views including HTML views, PDF and ePub downloads, according to the available data) and Abstracts Views on Vision4Press platform.
Data correspond to usage on the plateform after 2015. The current usage metrics is available 48-96 hours after online publication and is updated daily on week days.
Initial download of the metrics may take a while.