Fig. 5
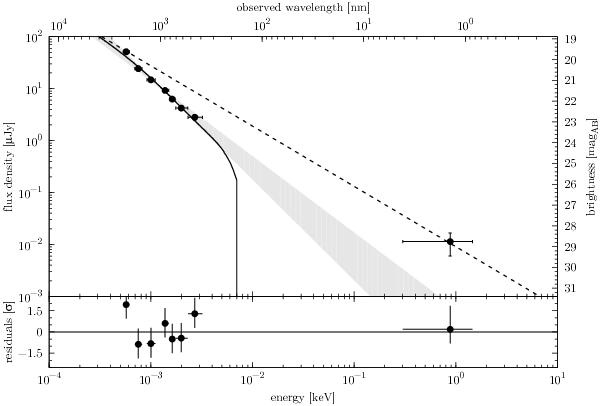
Broad-band spectral energy distribution of the afterglow of GRB 071028B including GROND and Swift/XRT data points. Based on the dust model of a starburst (SB), the shaded area represents the extrapolation of the optical and near-infrared data points with the best-fit spectral index of  and without dust. Using Minuit, the data points are best fit by a single power law with a spectral index of
  (dashed line) in combination with the dust model of an SB with an intrinsic extinction of
  (solid line).
Current usage metrics show cumulative count of Article Views (full-text article views including HTML views, PDF and ePub downloads, according to the available data) and Abstracts Views on Vision4Press platform.
Data correspond to usage on the plateform after 2015. The current usage metrics is available 48-96 hours after online publication and is updated daily on week days.
Initial download of the metrics may take a while.