Fig. 3
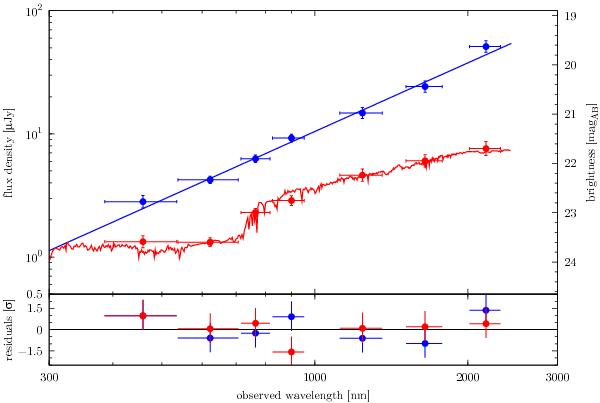
Optical and near-infrared spectral energy distributions of the afterglow (top) taken on October 30, 2007, at 01:50 UT (T0 + 2.0 d) and host galaxy (bottom) of GRB 071028B. Using HyperZ, the data points are best fit by a single power law with a spectral index of  (see Table 5) and a model of an Sb galaxy with a photometric redshift of
  (see Table 4).
Current usage metrics show cumulative count of Article Views (full-text article views including HTML views, PDF and ePub downloads, according to the available data) and Abstracts Views on Vision4Press platform.
Data correspond to usage on the plateform after 2015. The current usage metrics is available 48-96 hours after online publication and is updated daily on week days.
Initial download of the metrics may take a while.