Fig. 3
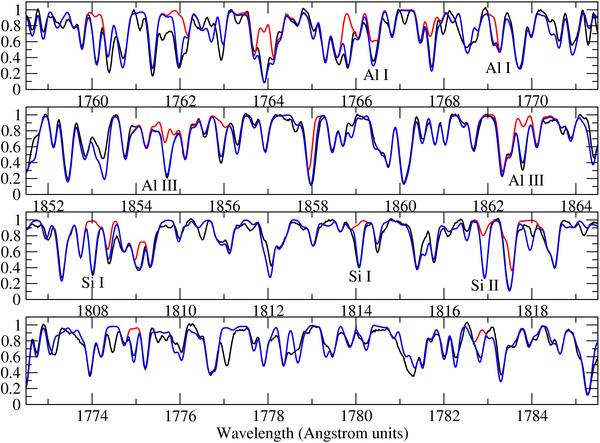
Fits to lines of Al i and ii (top panel), Al ii and iii (2nd panel), Si i and ii (3rd panel), and P i (bottom panel). Black curves are observed spectrum of Sirius A. Blue curves show fit with abundances from Table 1, red curves are synthetic spectra with fitted element removed. In the top two panels, aluminum lines are due to Al ii except as labelled.
Current usage metrics show cumulative count of Article Views (full-text article views including HTML views, PDF and ePub downloads, according to the available data) and Abstracts Views on Vision4Press platform.
Data correspond to usage on the plateform after 2015. The current usage metrics is available 48-96 hours after online publication and is updated daily on week days.
Initial download of the metrics may take a while.