Fig. 1
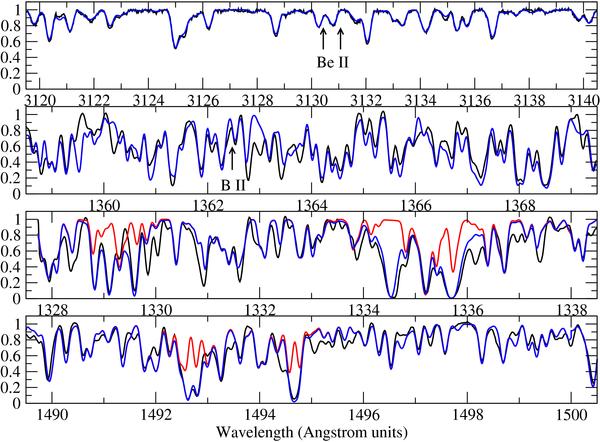
Fits to lines of Be ii (top panel), B ii (2nd panel), C i (1328–30 Å) and ii (1334–37 Å; 3rd panel), and N i (bottom panel). Black curves are observed spectrum of Sirius A. Blue curves show fit with abundances from Table 1, red curves are synthetic spectra with fitted element removed. The vertical axis is intensity normalised to the continuum. The wavelength scale is chosen for each panel so that the length of the boxes are all similar in velocity space, and the width in the figure of unblended single lines is similar regardless of the central wavelength. Exceptionally, in the two upper panels, the syntheses which best fit the observed spectrum do not require any Be or B, and so the red spectra with these elements removed are not shown. Instead the synthesis using the upper limit values to abundance for these elements are shown, and the positions of the relevant lines marked with arrows.
Current usage metrics show cumulative count of Article Views (full-text article views including HTML views, PDF and ePub downloads, according to the available data) and Abstracts Views on Vision4Press platform.
Data correspond to usage on the plateform after 2015. The current usage metrics is available 48-96 hours after online publication and is updated daily on week days.
Initial download of the metrics may take a while.