| Issue |
A&A
Volume 528, April 2011
|
|
|---|---|---|
| Article Number | A21 | |
| Number of page(s) | 15 | |
| Section | Stellar structure and evolution | |
| DOI | https://doi.org/10.1051/0004-6361/201016227 | |
| Published online | 21 February 2011 | |
The nearby eclipsing stellar system δ Velorum
II. First reliable orbit for the eclipsing pair⋆,⋆⋆
1
Astrophysikalisches Institut und Universitäts-Sternwarte,
Schillergäßchen 2-3,
07745
Jena,
Germany
e-mail: This email address is being protected from spambots. You need JavaScript enabled to view it.
; This email address is being protected from spambots. You need JavaScript enabled to view it.
2
Astronomical Institute, Slovak Academy of Sciences,
059 60
Tatranská Lomnica,
Slovakia
e-mail: This email address is being protected from spambots. You need JavaScript enabled to view it.
; This email address is being protected from spambots. You need JavaScript enabled to view it.
3
European Southern Observatory, Alonso de Cordova 3107, Vitacura, Santiago, Chile
e-mail: This email address is being protected from spambots. You need JavaScript enabled to view it.
4
LESIA, Observatoire de Paris, CNRSUMR8109, UPMC, Université Paris
Diderot, 5 place Jules
Janssen, 92195
Meudon,
France
e-mail: This email address is being protected from spambots. You need JavaScript enabled to view it.
5
School of Physics and Astronomy, University of Birmingham,
Edgbaston,
Birmingham, B15 2TT, UK
e-mail: This email address is being protected from spambots. You need JavaScript enabled to view it.
6
Astronomisches Institut, Ruhr-Universität Bochum, Universitätsstr.
150, 44801
Bochum,
Germany
e-mail: This email address is being protected from spambots. You need JavaScript enabled to view it.
; This email address is being protected from spambots. You need JavaScript enabled to view it.
7
Facultad de Ciencias, Universidad Católica del Norte,
Antofagasta,
Chile
8
ZAH, Landessternwarte Königstuhl, 69117
Heidelberg,
Germany
e-mail: This email address is being protected from spambots. You need JavaScript enabled to view it.
9
Institut für Astrophysik, Georg-August-Universität,
Friedrich-Hund-Platz
1, 37077
Göttingen,
Germany
e-mail: This email address is being protected from spambots. You need JavaScript enabled to view it.
Received: 29 November 2010
Accepted: 27 December 2010
Abstract
Context. The nearby multiple system δ Velorum contains a widely detached eclipsing binary and a third component.
Aims. We take advantage of this system offering the opportunity to determine the set of fundamental parameters (masses, luminosities, and radii) of three coeval stars with sufficient precision to test models of stellar evolution.
Methods. Extensive high-resolution spectroscopy is analyzed by the broadening function technique to provide the first spectroscopic orbit of the eclipsing pair. Simultaneous analysis of the spectroscopic data and the SMEI satellite light curve is performed to provide astrophysical parameters for the components. We use a modified Roche model assuming an eccentric orbit and asynchronous rotation.
Results. The observations show that components of the eclipsing pair rotate at about two-thirds of the break-up velocity, which excludes any chemical peculiarity and results in a non-uniform surface brightness. Although the inner orbit is eccentric, no apsidal motion is seen during the SMEI photometric observations. For the inner orbit, the orbital parameters are eccentricity e = 0.290, longitude of the periastron passage ω = 109°, and inclination 89.0°.
Conclusions. The component masses of MAa = 2.53 ± 0.11 M⊙, MAb = 2.37 ± 0.10 M⊙, and MB ~ 1.5 M⊙ combined with the inferred radii of the Aa and Ab components indicate that the eclipsing pair has already left the main sequence and that the estimated age of the system is about 400 Myr.
Key words: binaries: eclipsing / binaries: spectroscopic / stars: individual:δVelorum
Reduced échelle spectra of Delta Velorum are available at the CDS via anonymous ftp to cdsarc.u-strasbg.fr (130.79.128.5) or via http://cdsarc.u-strasbg.fr/viz-bin/qcat?J/A+A/528/A21
Table 1 and Figures 5, 6 are only available in electronic form at http://www.aanda.org
© ESO, 2011
1. Introduction
δ Velorum is one of the fifty brightest stars in the sky (V = 1.96) and is located only 24.4 pc from the Sun (π = 40.90 ± 0.38 mas; ESA 1997). For a long time, it has been known that it is a visual binary composed of the brighter component A with HP = 1.99 and the fainter component B with HP = 5.57 orbiting in a wide 142-year orbit (see Argyle et al. 2002).
Surprisingly, observations by visual observers, supported by photometry from the Galileo star tracker, led to the discovery that the brighter component of the visual pair is an eclipsing binary with P = 45.15 days (Otero et al. 2000). No complete and reliable observations of both eclipses, however, exist.
Spectroscopic observations of δ Velorum are also very limited. Levato (1972) obtained medium-dispersion (40 Å/mm) photographic spectra of the system and determined an A1V spectral type and a projected rotational speed of vsini = 85 km s-1. δ Velorum was later included in the survey of early-type Hipparcos targets of Royer et al. (2002), who took one échelle spectrum of the system. The Fourier transforms of two spectral lines were used to infer that vsini = 150 km s-1, which is rather inconsistent with the previous result. These measurements very probably included both A and B visual components. No line doubling has been noticed.
The δ Velorum system was observed interferometrically by Kellerer et al. (2007). Their observations consisted of 17 squared visibility measurements using VLTI/VINCI. Although VLTI clearly resolved the eclipsing pair, the presence of the visual component and the small number of observations caused the estimated parameters to be quite uncertain: semi-major axis a = 5.7 ± 0.3 × 10¹⁰ m, radii of the components RAa = 6.0 ± 0.5 R⊙, RAb = 3.3 ± 0.6 R⊙, eccentricity e = 0.230 ± 0.005, angle between the major axis and line of sight ω′ = −(20 ± 3)°1, and longitude of the ascending node Ω = 27.4 ± 1.2° with a reduced  .
.
Gáspár et al. (2008) discovered a spectacular IR bowshock around δ Velorum at 24 and 70 μm using Spitzer/MIPS images. This very large structure, ~1′, was explained by the authors as a result of the heating and compression of the interstellar medium by the photons from δ Velorum as the trio moves through the interstellar medium. Kervella et al. (2009) resolved the wide visual pair AB using the VISIR and NACO instruments at the VLT and obtained independent photometry of each of the Aa, Ab, and B components. Their photometry did not infer the large radii of the components, found by Kellerer et al. (2007). Mid-infrared observations presented by the authors exclude the presence of a circumstellar thermal excess around the system.
In spite of the above results, it is clear that a robust light-curve (hereafter LC) and spectroscopic analysis are necessary to provide reliable orbital elements and absolute parameters of the components.
2. New observations
2.1. SMEI satellite photometry
Because of its high brightness, δ Velorum is a difficult target for ground-based photometry. Unlike faint stars whose observation quality is dictated mostly by the shot and read-out noise, observations of the brightest stars are affected by the lack of nearby and sufficiently bright comparisons. Accompanying changes/differences in atmosphere transparency result in substantial amount of red noise. Covering eclipses of the eclipsing pair from ground-based observations is complicated by the long orbital period of P = 45.15 days.
In the case of δ Velorum, the Solar Mass Ejection Imager (SMEI) provides a LC of sufficient precision. In addition to its primary task, SMEI, attached to the Coriolis satellite, is capable of producing high-precision photometric time-series for stars up to V = 7 (see e.g., Bruntt et al. 2006; Tarrant et al. 2008; Spreckley & Stevens, 2008). In a similar way to the MOST satellite (see Walker et al. 2003), Coriolis stays close to the dawn-dusk terminator with an orbital frequency of 14.17 cycles/day. Its three cameras take narrow scans of the sky, but when combined, they provide almost full-sky coverage. Of the 3 cameras that make up SMEI, camera 3 operates at a higher temperature and has degraded photometric performance. We do not use data from camera 3 and this means we do not have continuous coverage of δ Velorum. We refer to Goss et al. (2010) and references therein, for more details about SMEI.
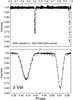 |
Fig. 1 Detrended and filtered (removing obvious outliers) SMEI LC of δ Vel. The data were phased using the following ephemeris for the periastron passage: To = HJD 2 452 528.950 + 45.15023 × E (see Table 2). Only data from 2003-2006 are plotted. |
The LC of δ Velorum generated from the SMEI images consist of 11195 points covering 5.6 years. The data were obtained during seven observing seasons (winter half of the year). The photometry is rather sparse, consisting of mostly one observation per the satellite orbit. Owing to the very long orbital period of the eclipsing pair, and the short duration of the eclipses, ΔT (pri) = 0.613 days and ΔT (s) = 0.896 days, only about 350 observations were obtained during the eclipses. By combining nine secondary minima determined from the SMEI photometry and that obtained by the Galileo satellite tracker (Otero, 2000) results in an ephemeris of Min II = HJD 2 447 851.693(9) + 45.15023(7) × E. The SMEI LC does not show apsidal motion. Because of the low angular resolution of the SMEI cameras, both components of the visual pair contribute to the extracted LC.
The quality of the SMEI photometry has been deteriorating since the launch of the satellite. Hence, in the analysis presented here only earlier data (2003–2006) have been used (Fig. 1).
2.2. BESO spectroscopy
Available spectroscopy of δ Velorum is very limited in spite of its brightness of V = 1.96. Two high-resolution échelle spectra are available in the ESO/FEROS data archive taken on November 25, 2004 and January 7, 2009 (both outside eclipses). There is practically no difference in the shape of the line profiles between the two spectra nor any indication that δ Velorum is a SB2 system. The system has also been observed by ESO/HARPS. Unfortunately, the spectra available in the ESO archive do not sufficiently cover the orbital cycle and are of low signal-to-noise ratio (S/N).
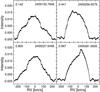 |
Fig. 2 Broadening functions close to the principal phases (counted from the primary eclipse, with the secondary occurring at phase 0.436): 0.142 (maximum separation of the components), 0.441 (end of the secondary eclipse), 0.800 (maximum separation of the components), and 0.997 (beginning of the primary eclipse). The radial velocity system is barycentric. Full mosaic showing all BFs including best fits is shown in Fig. 6. |
New optical spectroscopy of δ Velorum has been obtained at the Cerro Armazones Observatory using the BESO échelle spectrograph fiber-fed from the Cassegrain focus of the 1.5 m Hexapod Telescope (hereafter HPT, see Fuhrmann et al. 2010). Sixty-three spectra were obtained between April 2009 and April 2010. The spectra cover a 3530 − 8860 Å wavelength range. The data were reduced using dedicated ESO-MIDAS scripts. The photometric reduction includes overscan, bias, and flat-field correction. In subsequent steps individual échelle orders were then extracted, wavelength calibrated, and normalized to the continuum. Finally, cosmic-ray spikes were removed. Wavelength calibration was later improved using telluric bands close to 6900 and 7600 Å using the spectrum of η CMa as the telluric template. The improved RV system is stable to about 100 m s-1 as indicated by the RV difference between the spectral bands mentioned above. The absolute zero point of the system has not, however, been checked. Therefore, the systemic velocity of δ Velorum may be offset from its true value.
According to the VLT/NACO imaging of Kervella et al. (2009), the separation of the optical pair A-B was about 0.6″ in 2008. Because of a PSF of 3–5′′ at the HPT, both visual components were included in the fiber entrance. Hence, it is reasonable to assume that no light from the faint companion has got lost. The PSF required exposure times of typically 300–900 s, resulting in S/N ratios ranging from about 100 to 400. The journal of observations can be found in Table 1.
The aforementioned sixty-three spectra cover more-or-less uniformly the orbital cycle of δ Velorum. Several spectra were intentionally taken during the eclipses. All reduced one-dimensional spectra will be available at the CDS.
3. Data analysis
3.1. Orientation of the orbit
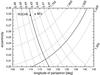 |
Fig. 3 Phase of the secondary minimum (labelled values are 0.40−0.46; the observed phase is 0.436) and ratio of minima durations (with labelled values 1.3−1.7; the observed ratio is 1.462). The lines are valid for an inclination angle of ~90°. Thick solid lines represent the observed values and their intersection indicates that e = 0.20−0.22 and ω = 115−120°. The resulting orientation and eccentricity of the orbit plotted for simple BF modelling (Sect. 3.2) and ROCHE modelling (Sect. 3.3) shows that i < 90°. |
In principle, the orientation and eccentricity of the orbit can be estimated from the position (phase) of the secondary minimum and ratio of the minima durations (see analysis of Kellerer et al. 2007). If we denote the deeper minimum as the primary and assume that the orbit is seen edge-on, from the observed minima durations and secondary minimum phase in the case of δ Velorum, one infers that e = 0.20−0.22 and ω = 115−120° (see Fig. 3). The longitude of the periastron refers to the orbit of the component eclipsed in the primary minimum. When we refer to the orbit of the component eclipsed in the secondary minimum, we must convert ω → ω + 180°.
The case of eccentric orbits with i ≠ 90° is not that simple because (i) the ratio of minima depths does not reflect the ratio of the surface brightnesses of the components (in the deeper, primary minimum even the cooler and less massive component can be eclipsed); (ii) the ratio of minima width cannot be used to find esinω. If ω ≠ 90° nor 270°, for sufficiently low inclination angles the minimum occurring further away from the periastron can disappear and the observer can detect only one system of minima. This is the case for e.g., BD+37 410 (Pribulla et al. 2010) or NY Cep (see Holmgren et al. 1990).
None of the minima of δ Velorum (see Fig. 1) shows a constant brightness interval. This means that at least one minimum is partial2 with i < 90°. Hence, exact eclipse modeling is needed to derive reliable parameters.
3.2. Extracting Doppler information and a preliminary orbit
Besides the Balmer series, there are few other strong lines in the optical spectrum of δ Velorum. The optimal spectral region for extracting Doppler information is the blue spectrum between 4370−4605 Å. In addition to the fairly strong Mg II 4481, line it contains many weaker metallic lines (mostly of Fe I) but is devoid of hydrogen lines. This blue part of the spectra was deconvolved using a high-resolution synthetic spectrum corresponding to Teff = 9500 K, log g = 4.5, solar metallicity3, and, a non-rotating star to obtain broadening functions (BFs) using the formalism developed by Rucinski (1992). Extracted BFs were smoothed by convolving with a Gaussian function (σ = 10 km s-1) to match the spectral resolution of BESO.
The template provided a very good match to the observed spectra indicated by the BF integral being close to unity (on average about 0.97). Using a hotter template with Teff = 10 000 K, log g = 4.5, and metallicity 0.5 dex lower than the solar one, we derived BF integrals of about 1.58. The BF integral depends on the strength of metallic lines in the region, hence a good spectral match can be provided by synthetic template of lower temperature and lower metallicity or by using a template of higher temperature and higher metallicity.
Extracted BFs clearly show that δ Velorum is a SB2. Unfortunately, profiles of the components are always blended (see Fig. 2). The orbital motion can be, however, well seen from strong changes in the total width and shapes of BFs. The deformed shapes of BFs close to spectroscopic conjunctions confirm that eclipses are detected in the system. We note that the extracted BFs do not show any presence of the visual component B in the system despite its expected contribution of about 3.7% (in the wide Hp passband4). We also produced an average spectrum of δ Velorum and extracted the corresponding BF. In this way, the orbital motion of the eclipsing pair is smeared-out but no additional component can be seen. This indicates that the visual component B is also a rapid rotator or a SB1/SB2 system. Another possible explanation is that the spectral type of the third component is too different to be picked up in the spectrum using the A0 template.
Because the profiles of the components are never separated and we observe only blends of variable shape, it is impossible to directly determine the RVs of the components. Hence, we modeled the whole dataset (with a single set of parameters) assuming that (i) the width and shape of the rotational profiles of the components do not change with phase; (ii) the relative intensity of the components is constant; (iii) the limb darkening is the same for both components; (iv) there is no apsidal motion visible in our data (as indicated by the long-period of the eclipsing pair); and (v) stars rotate as solid bodies (no differential rotation). To fulfill the first two conditions, the spectra taken during the eclipses were neglected. The standard deviation of each BF was determined using its violet part which was always outside of the component’s profiles.
Parameters of the eclipsing pair in the δ Velorum system.
In the case of solid-body rotation and a linear limb-darkening law, the rotational profile is an analytic function. The BF observed outside the eclipses is just the sum of two rotational profiles as given by Gray (1976). The limb darkening coefficient was fixed to be uAa = uAb = 0.522 as appropriate for an A0V star ( = 9420 K, Popper, 1980) with log g = 4.5 and λ = 4400 Å. Global fitting to all observed BFs included the following parameters: orbital eccentricity e; longitude and time of the periastron passage T0, ω; systemic velocity VA; sum of semi-amplitudes of the RV changes KAa + KAb; mass ratio q = MAb/MAa; background level of BFs5B0; intensities of the profiles IAa, IAb; and projected rotational velocities of the components vAasini, vAbsini. The orbital period P was held fixed at the photometrically determined value, P = 45.15023 days, because of the relatively short time-span of the observations.
The convergence process was repeated starting at many (dozens) parameter sets. Modeling showed that the component eclipsed in the primary minimum is the more massive of the two.
The optimization always resulted in the same parameters (listed in Table 2) indicating uniqueness of the solution (see Fig. 5 showing fits to all BFs outside eclipses). The effect of the limb darkening is small but not negligible. For the acceptable temperature range, 8750 K (A2V) to 10 000 K (B9.5V), the principal parameters lie within the following ranges: e = [0.2889, 0.2924], KAa + KAb = [104.41, 105.27] km s-1, vAasini = [139.11, 140.21] km s-1, and vAbsini = [146.48, 147.58] km s-1. It is clear that the systematic uncertainties (connected with the uncertain temperature and the limb darkening coefficient) are larger than those determined from residuals and the covariance matrix. The reduced  corresponding to the tested temperature range changes by only 3.1% (lowest occurs for Teff = 8750 K). For any solution, it is clear that the component being eclipsed in the primary minimum is the more massive of the two. The goodness of the fit,
  is indicative of underestimated errors in the BFs or/and a too simple model being used to fit the data.
For the solution corresponding to A0V stars, the ratio of fluxes is 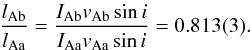 (1)The brightness ratio should be interpreted with caution because in extracting BFs the same template was used for both components. In the case that the spectral type of the secondary was later (or better strength of the metallic lines was larger) the estimated light ratio is the upper estimate. Results of the following Sect. 3.3 indicate, however, that the temperatures of the components are very similar.
The corresponding masses of the components are MAasin3i = 2.439(20) M⊙, and MAbsin3i = 2.288(18) M⊙ (the mass ratio is then 0.938(11)). Considering the full acceptable range of temperatures, the masses fall within 2.4308 < MAasin3i < 2.4516 M⊙ and 2.2709 < MAbsin3i < 2.2950 M⊙. Because the inclination angle is ~89° (see Sect. 3.3), the projected masses are close to the true masses (a 1% increase in mass occurs for an inclination i = 85.3°).
The BFs, very probably, contain a weak signature of the visual component B. Its separate spectrum would, however, be needed to remove its influence on BFs and the determined orbital elements. If it were a single but rapidly-rotating star (having a profile with a constant RV), it would effectively bring the components of the eclipsing pair together, reducing (KAa + KAb) and also alter the derived rotational velocities. Because of a severe blending of the primary and secondary lines, it is also impossible to check whether the components rotate as a solid body or differentially.
3.3. Simultaneous analysis of photometry and spectroscopy
Assuming that the apsidal motion is very slow6 and the orbital period is stable, we can combine SMEI (broadband) LC and OCA échelle spectroscopy (63 BFs) to help us derive consistent parameters for the system.
Data modeling has been performed using an updated version of the code ROCHE (Pribulla, 2004). The code assumes Roche model defining the surface geometry and local gravity on the components. Solid-body rotation was assumed. It is assumed (as suggested by Wilson, 1979) that the components can adjust their shape7 to slightly changing equipotential surfaces in the case of an eccentric orbit. The generalization of the Roche model for asynchronous rotation was also applied. Surface grids are derived from an icosahedron, resulting in practically equal elements. For both stars, it was assumed that the Von Zeipel (1924) law (appropriate for radiative envelopes) dictates local temperature. Single mutual reflection/irradiation was computed.
The optimized parameters are as follows: inclination angle i, generalized equipotentials ΩAa, ΩAb, asynchronous rotation factors FAa, FAb8, mass ratio q, polar temperature of the secondary  , sum of semi-amplitudes KAa + KAb, systemic velocity VA, longitude of periastron ω, eccentricity e, global normalization factor of BFs (should be unity in the case of perfect template match), and the global level of the BF background. Linear limb darkening coefficients uAa, uAb were automatically recalculated, interpolating from tables of van Hamme (1993) according to the mean surface gravity and wavelength range (separately for LCs and BFs). Local surface intensities were interpolated from tables of Lejeune et al. (1997) for each surface grid point. Because of the changing distance and shape of the components, both the surface grid and local parameters had to be recalculated for each step in phase (360 steps/orbit). During the eclipses, a four-times finer phase step was used.
The scatter in whole individual datasets was estimated by performing polynomial fitting to constant regions: in the case of the SMEI LC, we used out-of-eclipse phases, for BF parts outside the blended profile. To constrain the solution more tightly, only eclipse parts of the SMEI LC were used. Resulting parameters are listed in Table 2. The combined solution gives true (not projected) masses of the components as MAa = 2.53 ± 0.11 M⊙ and MAb = 2.37 ± 0.10 M⊙ (sin3i = 0.99954).
The best fits to both eclipses, as observed by the SMEI satellite, are shown in Fig. 1, and fits to all BFs are available in Fig. 6. The best fits to the BFs including eclipses do not uncover any systematic discrepancies. Small differences in the shapes of the minima branches of the SMEI LC can, however, be seen. This may be the result of a simplified treatment of the limb darkening effect9 or small departures of the component shapes from the generalized Roche model. By comparing spectroscopic elements obtained by assuming two limb-darkened rapidly rotating spheres (Sect. 3.2) to those obtained by the more realistic modeling by assuming a Roche geometry including all proximity effects, we find that the results are quite reliable. The major difference between the two cases concerns the mass ratio and the total mass of the system (given by KAa + KAb), which is higher in the case of full modeling.
Because of the enormous amount of CPU time required to model the deformed (and varying) shapes of the components with the orbital revolution, it is practically impossible to survey the whole parameter space and any possible correlations between parameters. Some properties of the solution and of information contained in the data are as follows:
-
unlike LCs, the BFs alone do not define both the eccentricity andthe orientation of the orbit very well. Fixing eccentricity atdifferent reasonable values gives acceptable range e = [0.24, 0.33] without any obvious correlation to ω, always being [112,116]°;
-
the LC alone defines inclination angle very well because of the small fractional radii of the components, but there is a correlation between the radii of the components and the inclination angle. The solution shows that both eclipses are partial – the visible surfaces of the component eclipsed in the minima are 35.6% (primary minimum) and 40.8% (secondary minimum);
-
including asynchronous rotation in the computation of the component’s shapes does not improve the solution significantly. The presence of fast asynchronous rotation cannot be inferred from the photometry alone. The information content of one broad-band LC is clearly much smaller than that of many BFs obtained at different phases.
-
by assuming no gravity darkening (βAa = βAb = 0.00), the fits to the LCs and BFs become poorer by only 5% and 2% (according to
 ). This means that it is impossible to reliably determine the gravity darkening coefficient from the present data;
 -
the combined solution shows that the secondary component is slightly hotter than the primary. This information cannot be inferred from BF modeling alone.
4. The triple system δ Velorum
The total mass of the whole triple system δ Velorum as determined by Argyle et al. (2002) is rather uncertain: 5.71 M⊙ (assuming the Hipparcos parallax, π = 40.90 ± 0.38 mas). The authors give visual magnitudes of the components as VA = 1.97 and VB = 5.55, corresponding to absolute magnitudes of MV(A) = 0.02 and MV(B) = 3.60. The visual orbit was determined based on the data from 1895 until 1999. Because of the most recent periastron passage (2000.8 according to their orbit), any new positional measurements of the visual pair could significantly improve the orbit. The new observation (NACO/VLT on April 1, 2008) of Kervella et al. (2009) enables us to measure a separation between the components of about 0.6″ (their Fig. 2), confirming the orbit of Argyle et al. (2002).
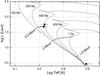 |
Fig. 4 Theoretical isochrones for solar composition (X = 0.70, Y = 0.28, Z = 0.02) assuming overshooting adopted from Claret (2004). Positions of all three components of δ Velorum are shown. Thick solid lines correspond to masses 1.5 M⊙, 2 M⊙, and 2.5 M⊙. Luminosities of Aa and Ab correspond to the combined solution, while for component B the luminosity was derived from the Hipparcos distance and observed visual magnitude. Horizontal error bars for the components of the eclipsing pair correspond to the surface temperature ranges due to the gravity brightening. |
Our combined LC and BF solution gives the following luminosities for the components: LAa = 56.3 L⊙ and LAb = 47.1 L⊙. Taking the absolute bolometric magnitude of Sun as  and bolometric correction for components of δ Vel (A0V) as B.C. = − 0.15 (Popper 1980), we derive the absolute visual magnitudes of the components to be MV(Aa) = + 0.519 and MV(Ab) = + 0.719. This gives a combined magnitude of MV(A) = − 0.138, which is substantially brighter than the reliable value determined from the observed visual brightness and Hipparcos distance by Argyle et al. (2002). This simple computation, however, does not take into account that the observer faces the coldest (equatorial) part of the system. The apparent magnitudes of the eclipsing pair synthesized by the ROCHE code (including all proximity effects and gravity darkening), U = 1.98 ± 0.02, B = 1.94 ± 0.02, V = 1.95 ± 0.02, and K = 1.86 ± 0.02 are in very good agreement with the observations: Kervella et al. (2009) found V (Aab) = 2.00 ± 0.02 and K (Aab) = 1.86 ± 0.09.
The positions of all three components in the H-R diagram and the theoretical isochrones are plotted in Fig. 4. Assuming that the third component is still on the main sequence10, its absolute visual magnitude, MV(B) = 3.60, corresponds to F2-F5 spectral type or according to Cox (2000) to  K and luminosity LB = 3.19 − 3.56 L⊙. In the H-R diagram, component B is slightly above the main sequence, supporting the earlier limit for the spectral type, namely F2V. The positions of components of the eclipsing pair Aa, Ab plotted in Fig. 4 were derived from the combined solution to all BFs and SMEI LC for
  K.
K.
The observed masses and radii of the components correspond most closely to the model predictions (Claret 2004, Y = 0.70, Z = 0.02, and overshooting) for 400 Myr, when the temperatures of components are assumed to be TAa = 9470 K, TAb = 9370 K, RAa = 2.643 R⊙, and RAb = 2.363 R⊙. The corresponding apsidal motion constants are log k2 (Aa) = − 2.4972 and log k2 (Ab) = − 2.4626. The observed radii of stars are still about 5–6% larger, giving additional support to measurements of lower temperature and a slightly older age than 400 Myr – soon after 400 Myr, the temperatures of the components equalize (as observed) because of the slightly faster evolution of the more massive primary component. The next isochrone available from Claret (2004) for 630 Myr predicts that TAa = 7980 K, TAb = 8132 K, RAa = 4.263 R⊙, and RAb = 3.393 R⊙. The evolution of the components could, however, be affected by fast rotation, making the main-sequence phase last longer (see e.g., de Mink 2010).
5. Discussion and future work
Our new data has enabled the first sound analysis of the eclipsing pair Aab in the δ Velorum system. The main results are as follows:
-
both minima are partial. For the given orientation of the or-bit and assuming (fairly similar) the derived radii of com-ponents, the total eclipse and annular transit occur only ifi > 89.8°;
-
the components of the eclipsing pair are a factor of two smaller than derived interferometrically by Kellerer et al. (2007);
-
the brightness ratio of brightness of components in the SMEI passband (close to the R passband) is about 0.823. The components are of similar temperature, however, both very probably being of spectral type A1V. This is strongly supported by a close agreement with the synthetic depth of the primary minimum in the K passband Δmag I = 0.430, while Kervella et al. (2009) determined Δmag I = 0.440 ± 0.011 from the NACO imaging during the primary eclipse;
-
there is no apsidal motion in the system observed during the six-year time-series of the SMEI data as indicated by the observed times of the minima;
-
photocenter motion of the eclipsing pair (corresponding to our solution) is only about 1 mas: it was not detected by the Hipparcos satellite;
-
both components rotate very rapidly: the primary at about 56% of the break-up velocity, the secondary at about 62%. This also means that the components are strongly deformed. When the surface can be accurately described by a generalized ROCHE model, the polar flattening of the components is 1/10 and 1/12. Because of the fast rotation, the surface temperatures are rather non-uniform. The von Zeipel theorem predicts the following ranges: 9220 K
 K and 9280 K
  9880 K11. This effect should be confirmed by long-baseline interferometry;
 -
the best fits to the BFs extracted during the primary transit (spectra taken at phases 0.995, 0.997, 0.000, and 0.002) shows just slight deviations indicating that the rotational axis of the primary component is almost perpendicular to the orbital plane. The secondary minimum, occurring around phase 0.436, is insufficiently covered (a single spectrum at phase 0.441) by the spectroscopic observations to be able to derive any information about the rotational axis orientation;
-
the spectral type of δ Velorum A is most probably A1V, although different approaches infer a fairly wide range of results: (i) the BF strength indicates that
 K (A0V) (see Sect. 3.2); (ii) a combination of the observed visual brightness, Hipparcos distance, and radii of the components (simultaneous solution in Sect. 3.3) supports a similar temperature, 9420 K; (iii) the observed colors U − V = 0.11, B − V = 0.04, V − R = 0.05, and V − I = 0.09 imply a later classification, A1-2V (see Stickland & Hucht, 1977); (iv) the shape and intensity of the Hβ line (in our BESO spectra) corresponds most closely to a higher temperature, = 10 000 K and log gA = 4.5–4.6 (B9.5V); and (v) Gray (2006) gives a spectral type of A1Va(n), Teff = 9021 K, log g = 3.79, and log [M/H] = − 0.33. Because the system is very close, no interstellar reddening is expected. On the other hand, the presence of circumstellar material around δ Velorum cannot be fully excluded.
In spite of significant progress, the astrophysical parameters of δ Vel should still be verified. The total mass of the system is slightly affected by the unknown nature (multiplicity, rotation rate) of the third component (δ Velorum B). To correctly remove its contribution to the observed line profiles, it will be necessary to acquire its spectrum separately. This task will not be easy: the separation between the components will become smaller until 2013 when it reaches 0.38″. The separation then should slowly increase until 2067, reaching about 2.9″.
Our phase-resolved spectra may still need to be precessed by the Fourier disentangling (see Hadrava, 1995) to obtain the individual spectra of components and their astrophysical parameters (log g, Teff, metallicity etc.). Because of the strong rotational mixing, any chemical peculiarity is, however, excluded. Most importantly, the combination of the present data with long-baseline interferometry will be required, which may possibly detect the flattening of the components and “polar caps” brightening caused by the rapid rotation. This additional dataset would break the parameter correlations complicating the present modeling.
Additional high-resolution spectroscopy should be secured during the eclipses to study the Rossiter-McLaughlin effect. Photometric eclipse modeling can still be improved by dedicated multi-color photometry of the transits, which is important for a clearer definition of the surface brightness ratio.
Another possible way to improve the outer visual orbit is to use timing of the minima of the eclipsing pair, which should show a light-time effect. The expected semi-amplitude, for the visual orbit of Argyle et al. (2002), is about 1.5 h. In view of the large vsini of the components and the blending of their profiles, systemic-velocity changes in the eclipsing pair would be hardly detectable nor useful.
Online material
Journal of spectroscopic observations at Cerro Armazones Observatory.
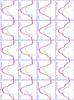 |
Fig. 5 Rotational profile fit to all broadening functions outside eclipses. The panels give the orbital phase and the heliocentric Julian date (with 2 400 000 subtracted). The profile of the primary component (Aa) is plotted in black, the profile of the secondary component (Ab) in green, and the combined profile in blue. |
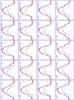 |
Fig. 5 continued. |
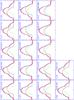 |
Fig. 5 continued. |
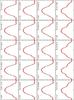 |
Fig. 6 The ROCHE-model fit to all broadening functions. The panels give the orbital phase and the heliocentric Julian date (with 2 400 000 subtracted). |
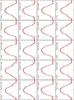 |
Fig. 6 continued. |
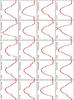 |
Fig. 6 continued. |
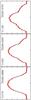 |
Fig. 6 continued. |
This angle transforms into a longitude of periastron of .
Total minimum can still be a transit, curved because of the limb darkening.
The spectrum was taken from the Pollux database available online at http://pollux.graal.univ-montp2.fr/
The maximum response of the Hipparcos photometric system lies within spectral range used to extract the BFs.
For both a perfect match between the spectral types of the template and observed star and proper rectification to the continuum, it should be zero.
In the case of δ Velorum, an eccentric orbit causes very small changes in the true radii with orbital phase, e.g., ΔRpoint/R ~ 7 × 10⁻⁵. The shapes of the components are much more affected by fast asynchronous rotation.
For bound rotation, FAa = FAb = 1.
The limb-darkening coefficients are assumed to be constant over the surface of components.
It is the least massive of the trio, with a significant turn-off from the main sequence at ages older than 1 Gyr, excluded by the evolutionary state of the eclipsing pair.
Surface temperature increases from the equator to the poles.
Acknowledgments
M.V. and T.P. acknowledge support from the EU in the FP6 MC ToK project MTKD-CT-2006-042514. This work has partially been supported by VEGA project 2/0038/10.
This publication is supported as a project of the Nordrhein-Westfälische Akademie der Wissenschaften und der Künste in the framework of the academy program by the Federal Republic of Germany and the state Nordrhein-Westfalen.
M.A. acknowledges research funding granted by the Deutsche Forschungsgemeinschaft (DFG) under the project RE 1664/4-1. A.B. acknowledges support from DFG in program NE 515/32-1.
The research made use of the SIMBAD database, operated at the CDS, Strasbourg, France.
References
- Argyle, R. W., Alzner, A., & Horch, E. P. 2002, A&A, 384, 171 [NASA ADS] [CrossRef] [EDP Sciences] [Google Scholar]
- Bruntt, H., Southworth, J., Torres, G., et al. 2006, A&A, 456, 651 [NASA ADS] [CrossRef] [EDP Sciences] [Google Scholar]
- Claret, A. 2004, A&A, 424, 919 [NASA ADS] [CrossRef] [EDP Sciences] [Google Scholar]
- Cox, C. W. 2000, Allens Astrophysical Quantities (Springer Verlag) [Google Scholar]
- de Mink, S. 2010, Ph.D. Thesis, Utrecht University [Google Scholar]
- European Space Agency 1997, The Hipparcos and Tycho Catalogues (ESA SP-1200) (Noordwijk: ESA) [Google Scholar]
- Fuhrmann, K., Chini, R., Hoffmeister, V. H., et al. 2010, MNRAS, in press [Google Scholar]
- Gáspár, A., Su, K. Y. L., Rieke, G. H., et al. 2008, ApJ, 672, 974 [NASA ADS] [CrossRef] [Google Scholar]
- Goss, K. J. F., Karoff, C., Chaplin, W. J., Elsworth, Y., & Stevens, I. R. 2010, MNRAS, in press [Google Scholar]
- Gray, F. D. 1976, The Observation and Analysis of Stellar Photospheres (New York: Wiley) [Google Scholar]
- Gray, R. O., Corbally, C. J., Garrison, R. F., et al. 2006, AJ, 132, 161 [NASA ADS] [CrossRef] [Google Scholar]
- Hadrava, P. 1995, A&AS, 114, 393 [NASA ADS] [Google Scholar]
- Hilditch, R. W. 2001, An Introduction to Close Binary Stars, (Cambridge: University Press), 140 [Google Scholar]
- Holmgren, D. E., Hill, G., Fisher, W., & Scarfe, C. D. 1990, A&A, 231, 89 [NASA ADS] [Google Scholar]
- Kellerer, A., Petr-Gotzens, M. G., Kervella, P., & Coudé du Foresto, V. 2007, A&A, 469, 633 [NASA ADS] [CrossRef] [EDP Sciences] [Google Scholar]
- Kervella, P., Thévenin, F., & Petr-Gotzens, M. G. 2009, A&A 493, 107 [NASA ADS] [CrossRef] [EDP Sciences] [Google Scholar]
- Lejeune, Th., Cuisinier, F., & Buser, R. 1997, A&AS 125, 229 [NASA ADS] [CrossRef] [EDP Sciences] [Google Scholar]
- Levato, O. H. 1972, PASP, 84, 584 [NASA ADS] [CrossRef] [Google Scholar]
- Otero, S. A., Fieseler, P. D., & Lloyd, C. 2000, IBVS No. 4999 [Google Scholar]
- Popper, D. M. 1980, ARA&A, 18, 115 [NASA ADS] [CrossRef] [Google Scholar]
- Pribulla, T. 2004, in Spectroscopically and Spatially Resolving the Components of the Close Binary Stars, ed. R. W. Hilditch, H. Hensberge, & K. Pavlovski, ASP Conf. Ser., 318, 117 [Google Scholar]
- Pribulla, T., Rucinski, S. M., Latham, D. W., et al. 2010, AN, 331, 397 [Google Scholar]
- Royer, F., Gerbaldi, M., Faraggiana, R., & Gómez, A. E. 2002, A&A, 381, 105 [NASA ADS] [CrossRef] [EDP Sciences] [Google Scholar]
- Rucinski, S. M. 1992, AJ, 104, 1968 [NASA ADS] [CrossRef] [Google Scholar]
- Spreckley, S. A., & Stevens, I. R. 2008, MNRAS, 388, 1239 [NASA ADS] [Google Scholar]
- Stickland, D. J., & van der Hucht, K. A. 1977, A&A, 54, 883 [NASA ADS] [Google Scholar]
- Tarrant, N. J., Chaplin, W. J., Elsworth, Y. P., Spreckley, S. A., & Stevens, I. R. 2008, A&A, 492, 167 [NASA ADS] [CrossRef] [EDP Sciences] [Google Scholar]
- van Hamme, W. 1993, AJ, 106, 2096 [NASA ADS] [CrossRef] [Google Scholar]
- von Zeipel, H. 1924, MNRAS, 84, 665 [NASA ADS] [CrossRef] [Google Scholar]
- Walker, G., Matthews, J., Kuschnig, R., et al. 2003, PASP, 115, 1023 [NASA ADS] [CrossRef] [Google Scholar]
- Wilson, R. E. 1979, ApJ, 234, 1054 [NASA ADS] [CrossRef] [Google Scholar]
All Tables
All Figures
|
Fig. 1 Detrended and filtered (removing obvious outliers) SMEI LC of δ Vel. The data were phased using the following ephemeris for the periastron passage: To = HJD 2 452 528.950 + 45.15023 × E (see Table 2). Only data from 2003-2006 are plotted. |
| In the text | |
|
Fig. 2 Broadening functions close to the principal phases (counted from the primary eclipse, with the secondary occurring at phase 0.436): 0.142 (maximum separation of the components), 0.441 (end of the secondary eclipse), 0.800 (maximum separation of the components), and 0.997 (beginning of the primary eclipse). The radial velocity system is barycentric. Full mosaic showing all BFs including best fits is shown in Fig. 6. |
| In the text | |
|
Fig. 3 Phase of the secondary minimum (labelled values are 0.40−0.46; the observed phase is 0.436) and ratio of minima durations (with labelled values 1.3−1.7; the observed ratio is 1.462). The lines are valid for an inclination angle of ~90°. Thick solid lines represent the observed values and their intersection indicates that e = 0.20−0.22 and ω = 115−120°. The resulting orientation and eccentricity of the orbit plotted for simple BF modelling (Sect. 3.2) and ROCHE modelling (Sect. 3.3) shows that i < 90°. |
| In the text | |
|
Fig. 4 Theoretical isochrones for solar composition (X = 0.70, Y = 0.28, Z = 0.02) assuming overshooting adopted from Claret (2004). Positions of all three components of δ Velorum are shown. Thick solid lines correspond to masses 1.5 M⊙, 2 M⊙, and 2.5 M⊙. Luminosities of Aa and Ab correspond to the combined solution, while for component B the luminosity was derived from the Hipparcos distance and observed visual magnitude. Horizontal error bars for the components of the eclipsing pair correspond to the surface temperature ranges due to the gravity brightening. |
| In the text | |
|
Fig. 5 Rotational profile fit to all broadening functions outside eclipses. The panels give the orbital phase and the heliocentric Julian date (with 2 400 000 subtracted). The profile of the primary component (Aa) is plotted in black, the profile of the secondary component (Ab) in green, and the combined profile in blue. |
| In the text | |
|
Fig. 5 continued. |
| In the text | |
|
Fig. 5 continued. |
| In the text | |
|
Fig. 6 The ROCHE-model fit to all broadening functions. The panels give the orbital phase and the heliocentric Julian date (with 2 400 000 subtracted). |
| In the text | |
|
Fig. 6 continued. |
| In the text | |
|
Fig. 6 continued. |
| In the text | |
|
Fig. 6 continued. |
| In the text | |
Current usage metrics show cumulative count of Article Views (full-text article views including HTML views, PDF and ePub downloads, according to the available data) and Abstracts Views on Vision4Press platform.
Data correspond to usage on the plateform after 2015. The current usage metrics is available 48-96 hours after online publication and is updated daily on week days.
Initial download of the metrics may take a while.