Fig. 8
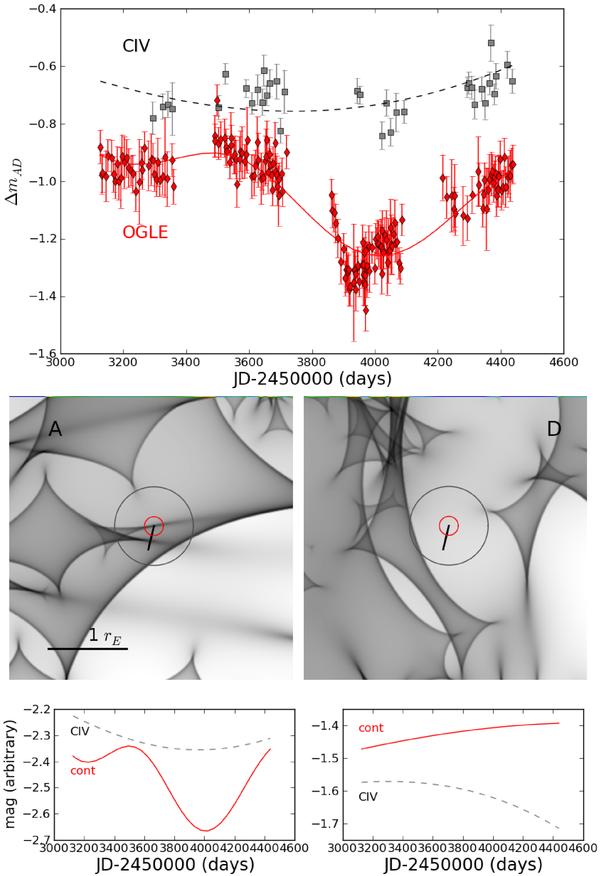
Top: example of a good track fitting the differential lightcurve ΔmAD observed for the C iv broad line and for the continuum. Centre: corresponding tracks (solid line) in the microlensing pattern of image A (left) and D (right). The large circle represents the C iv source size and the small one the continuum. Bottom: track corresponding to the continuum emission (red solid line) and to the C iv emitting region (dashed grey line) for image A (left) and D (right).
Current usage metrics show cumulative count of Article Views (full-text article views including HTML views, PDF and ePub downloads, according to the available data) and Abstracts Views on Vision4Press platform.
Data correspond to usage on the plateform after 2015. The current usage metrics is available 48-96 hours after online publication and is updated daily on week days.
Initial download of the metrics may take a while.