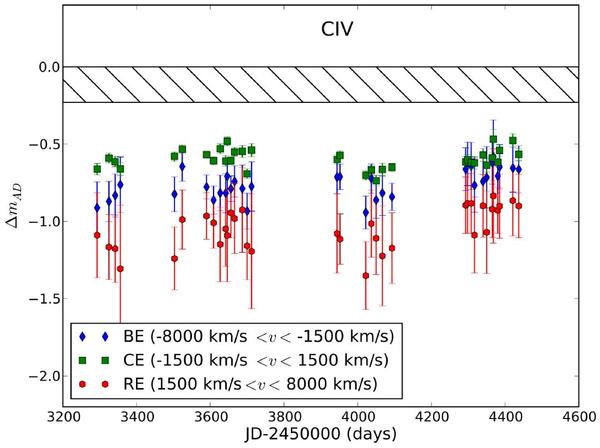
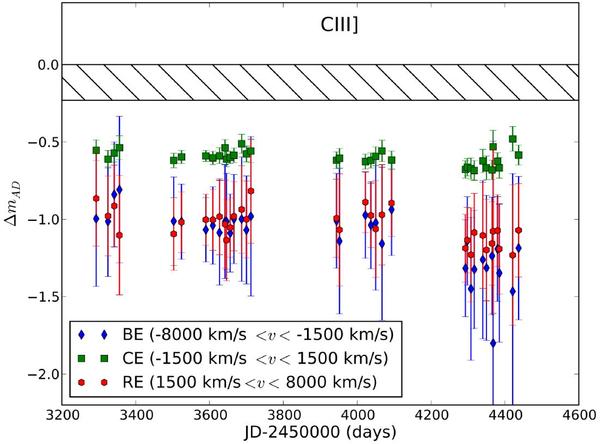
Fig. 5
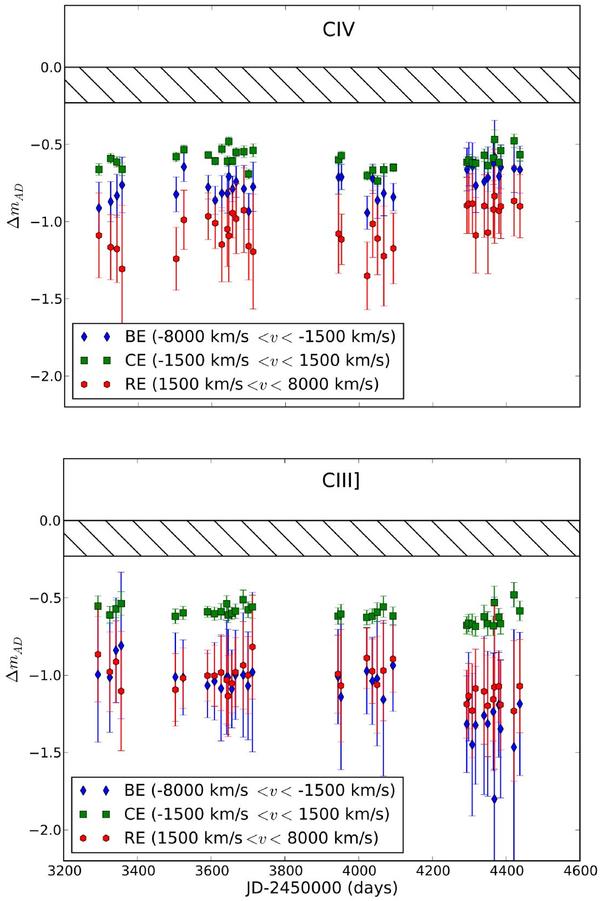
Time dependence of the magnitude difference between images A & D, ΔmAD, as measured in the blue wing (BE; blue diamond), line core (CE; green square) and red wing (RE; red hexagons) of the C iv (top) and C iii] (bottom) emission lines. The shaded area indicates the range of ΔmAD estimated from the macro-model and from MIR measurements.
Current usage metrics show cumulative count of Article Views (full-text article views including HTML views, PDF and ePub downloads, according to the available data) and Abstracts Views on Vision4Press platform.
Data correspond to usage on the plateform after 2015. The current usage metrics is available 48-96 hours after online publication and is updated daily on week days.
Initial download of the metrics may take a while.