Fig. 4
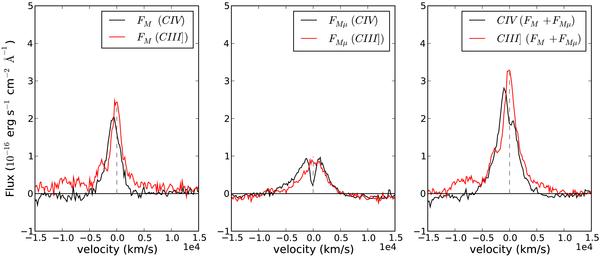
Macro-micro decomposition (MmD) technique applied to the C iv (black) and C iii] (red) emission lines observed on 2006-10-13. Left: fraction of the flux FM non affected by microlensing, Centre: fraction of the line FMμ affected by microlensing, Right: full emission line profile. The intensity of C iii] are multiplied by 2.2 to ease visual comparison between C iv and C iii] profiles. The vertical dashed line indicates the velocity zeropoint corresponding to the systemic redshift.
Current usage metrics show cumulative count of Article Views (full-text article views including HTML views, PDF and ePub downloads, according to the available data) and Abstracts Views on Vision4Press platform.
Data correspond to usage on the plateform after 2015. The current usage metrics is available 48-96 hours after online publication and is updated daily on week days.
Initial download of the metrics may take a while.