Fig. 3
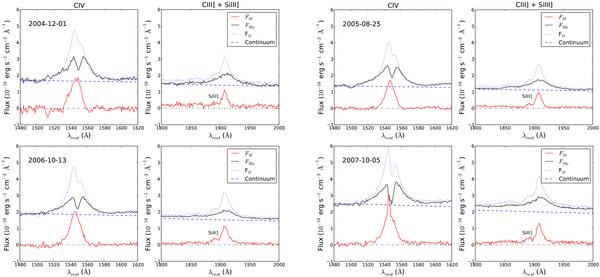
Macro-micro decomposition (MmD) of the C iv (left) and C iii]+Si iii] (right) emission lines obtained from the spectra of images A & D at 4 different epochs. In each panel, the black solid line shows the fraction of the spectrum FMμ affected by microlensing and the red solid line shows the emission FM which is too large to be microlensed. For comparison, we also display the observed spectrum of image D with a dotted blue line and the power-law continuum used to calculate μ(λ,t) with a dashed blue line.


Current usage metrics show cumulative count of Article Views (full-text article views including HTML views, PDF and ePub downloads, according to the available data) and Abstracts Views on Vision4Press platform.
Data correspond to usage on the plateform after 2015. The current usage metrics is available 48-96 hours after online publication and is updated daily on week days.
Initial download of the metrics may take a while.