Free Access
Fig. 11
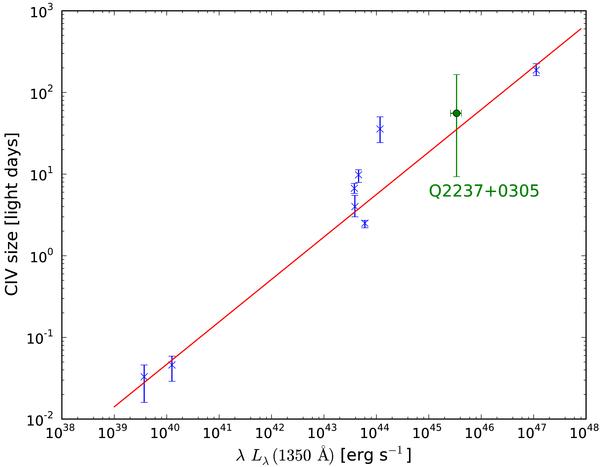
RC iv-L diagram combining reverberation mapping measurement of RC iv (“ × ” symbol, Peterson et al. 2005; Kaspi et al. 2007) and our microlensing-based size for QSO 2237 + 0305. The solid line is the analytical fit to the reverberation mapping data from Kaspi et al. (2007), which has a slope α = 0.52.
Current usage metrics show cumulative count of Article Views (full-text article views including HTML views, PDF and ePub downloads, according to the available data) and Abstracts Views on Vision4Press platform.
Data correspond to usage on the plateform after 2015. The current usage metrics is available 48-96 hours after online publication and is updated daily on week days.
Initial download of the metrics may take a while.