Fig. 8
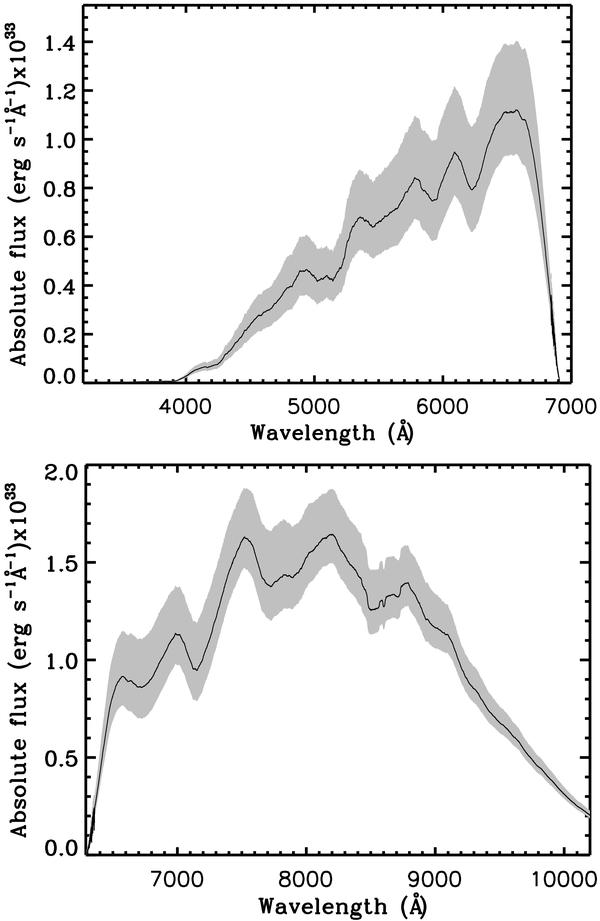
Spectral fluctuations in the blue and red Gaia photometric bands (Fig. 1) for RSGs: the black curve is the average flux over ~five years covered by the simulation, while the grey shade denotes the maximum and minimum fluctuations. The spectra were smoothed to theGaia spectral resolution (R ~ 50, Thévenin 2008).
Current usage metrics show cumulative count of Article Views (full-text article views including HTML views, PDF and ePub downloads, according to the available data) and Abstracts Views on Vision4Press platform.
Data correspond to usage on the plateform after 2015. The current usage metrics is available 48-96 hours after online publication and is updated daily on week days.
Initial download of the metrics may take a while.