Fig. 4
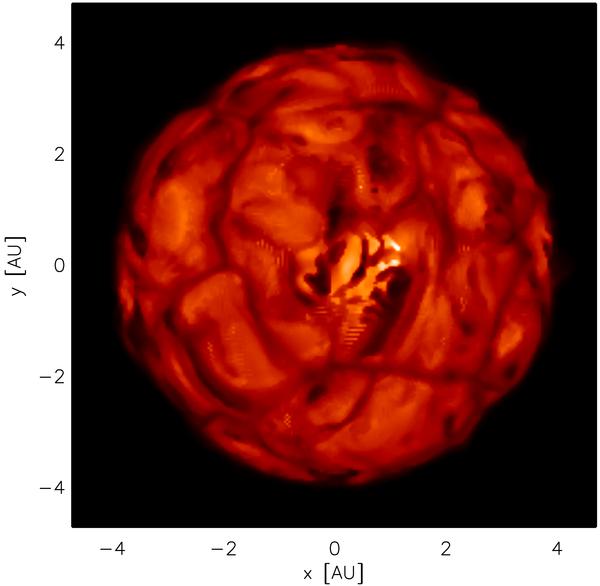
Map of the linear intensity in the IONIC filter (H band as described in Paper I). The range is [0–3.1 × 10⁵] erg cm-2 s-1 Å-1. The snapshot corresponds to the top left snapshot at t = 21.976 year in Fig. 2. The large convective cell visible in this figure is swamped in smaller-scale photospheric structures in the Gaia G band images.
Current usage metrics show cumulative count of Article Views (full-text article views including HTML views, PDF and ePub downloads, according to the available data) and Abstracts Views on Vision4Press platform.
Data correspond to usage on the plateform after 2015. The current usage metrics is available 48-96 hours after online publication and is updated daily on week days.
Initial download of the metrics may take a while.