Fig. 3
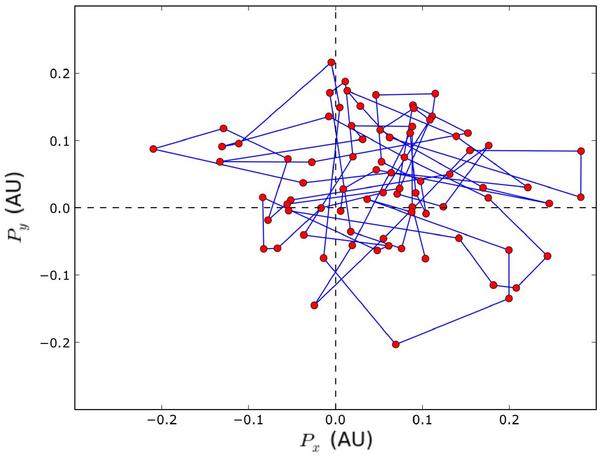
Photocentre position computed from the snapshots of Fig. 2, in the Gaia G band filter. The total simulated time is ~five years and the snapshots are 23 days apart. The snapshots are connected by the line segments. The dashed lines intersect at the position of the geometrical centre of the images. Note that the photocentric shift stays in the first quadrant for most of the 5 year simulation, and reflects the long lifetime of the large convective cell best visible in the infrared H band (Fig. 4).
Current usage metrics show cumulative count of Article Views (full-text article views including HTML views, PDF and ePub downloads, according to the available data) and Abstracts Views on Vision4Press platform.
Data correspond to usage on the plateform after 2015. The current usage metrics is available 48-96 hours after online publication and is updated daily on week days.
Initial download of the metrics may take a while.