Fig. 24
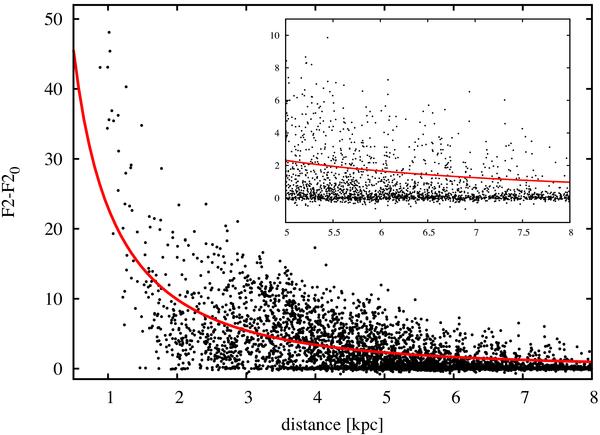
Same as Fig. 21 for the goodness-of-fit F2. The solid line corresponds to the prediction from Eq. (12), with ν = 70, σPθ = 0.1 AU and ση = 0.03 mas. Part of the large scatter at intermediate distances (2 to 4 kpc) is caused by a different CCD gating sequence (see de Bruijne 2005; Lindegren 2010).
Current usage metrics show cumulative count of Article Views (full-text article views including HTML views, PDF and ePub downloads, according to the available data) and Abstracts Views on Vision4Press platform.
Data correspond to usage on the plateform after 2015. The current usage metrics is available 48-96 hours after online publication and is updated daily on week days.
Initial download of the metrics may take a while.