Fig. 20
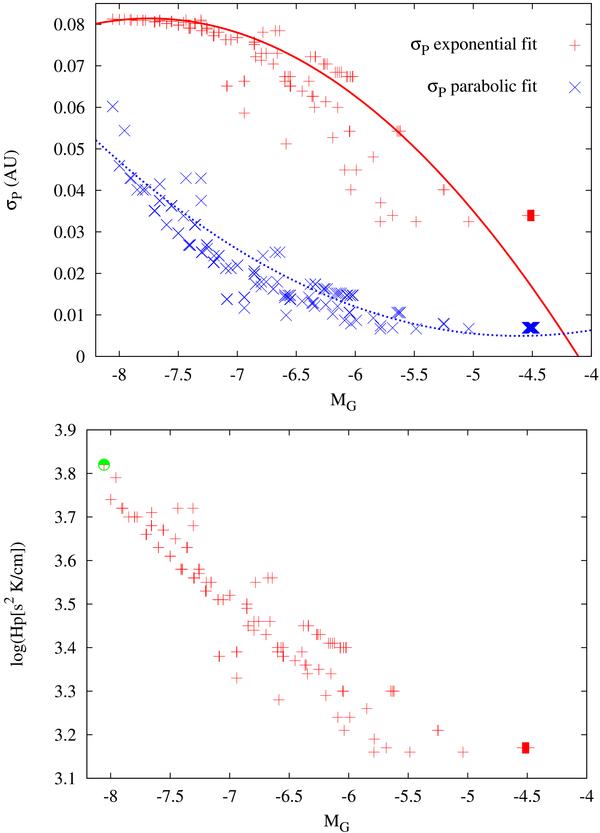
Upper panel: the relation between
σPθ and
MG for supergiants and bright giants,
assuming either an exponential (red plusses) or a parabola (blue crosses) to connect
the box-in-a-star with the star-in-a-box models (Fig. 18). The equation of the dashed green line (through the red plusses) is
 , whereas
the equation of the magenta dotted line (through the blue crosses) is
, whereas
the equation of the magenta dotted line (through the blue crosses) is
 .
Lower panel: same as the upper panel, for the relation between
the pressure scale height Hp and the absolute magnitude in the Gaia
G band. Only stars with a detectable photocentric motion (for the
exponential fit: red crosses; for the parabolic fit: green dot) have been plotted.
.
Lower panel: same as the upper panel, for the relation between
the pressure scale height Hp and the absolute magnitude in the Gaia
G band. Only stars with a detectable photocentric motion (for the
exponential fit: red crosses; for the parabolic fit: green dot) have been plotted.
Current usage metrics show cumulative count of Article Views (full-text article views including HTML views, PDF and ePub downloads, according to the available data) and Abstracts Views on Vision4Press platform.
Data correspond to usage on the plateform after 2015. The current usage metrics is available 48-96 hours after online publication and is updated daily on week days.
Initial download of the metrics may take a while.