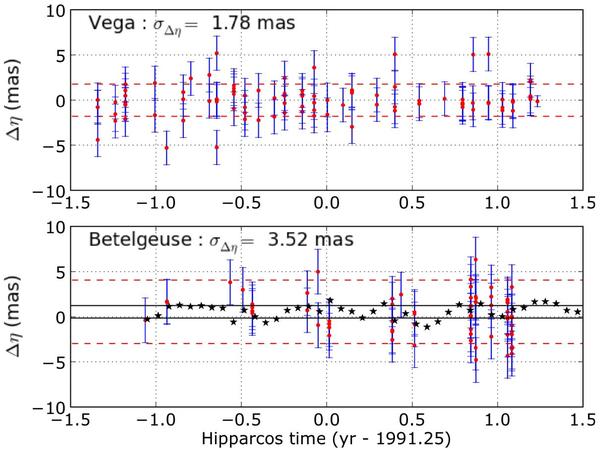
Fig. 15

Abscissa residuals Δη (in mas on the sky; red dots) along with the corresponding error bar from van Leeuwen (2007a) for Betelgeuse and Vega, as a function of time, expressed in years from 1991.25. Filled star symbols correspond to the along-scan projections Pθ of the synthetic photocentre displacements of Fig. 3. The red dashed lines and black solid lines depict the ± 1σ interval around the mean for the Hipparcos data points and model predictions, respectively. Note that these displacements were computed in the Gaia G filter instead of the Hipparcos Hp filter. A test on a given snapshot has shown that the difference is negligible: Px = 0.11 AU with the Hp filter, as compared to 0.13 AU with the G filter.
Current usage metrics show cumulative count of Article Views (full-text article views including HTML views, PDF and ePub downloads, according to the available data) and Abstracts Views on Vision4Press platform.
Data correspond to usage on the plateform after 2015. The current usage metrics is available 48-96 hours after online publication and is updated daily on week days.
Initial download of the metrics may take a while.


