Fig. 1

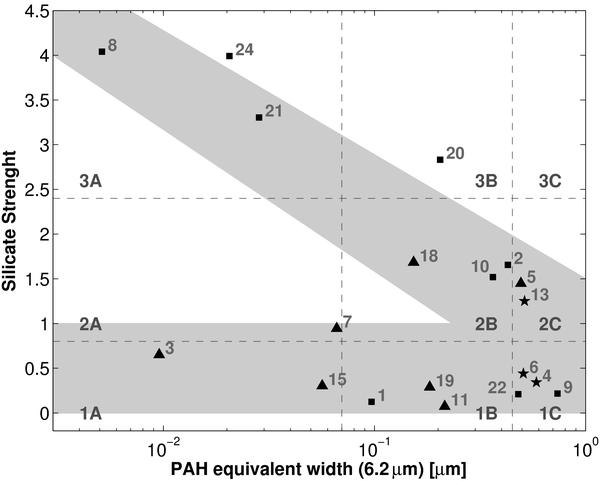
Position of the observed galaxies on the mid-infrared diagnostic diagram from Spoon et al. (2007). Galaxies are divided into nine classes (1A–3C), depending on their spectral properties and position on the graph. These classes range from PAH-dominated spectra (1C) to continuum-dominated spectra with faint PAH emission (1A) and obscured galaxies with deep silicate absorption (3A). Galaxy types are distinguished by their plotting symbol: squares: LIRGs. Stars: starburst galaxies. Triangles: seyfert galaxies. The numbers indicate different galaxies, as explained in Table 1. The shadowed area corresponds to the two main sequences discussed by Spoon et al. (2007). An increase of the PAH equivalent width indicates an increase of the starburst contribution to the emission, while AGN spectra are continuum-dominated. See Sect. 2 for further discussion.
Current usage metrics show cumulative count of Article Views (full-text article views including HTML views, PDF and ePub downloads, according to the available data) and Abstracts Views on Vision4Press platform.
Data correspond to usage on the plateform after 2015. The current usage metrics is available 48-96 hours after online publication and is updated daily on week days.
Initial download of the metrics may take a while.


