| Issue |
A&A
Volume 528, April 2011
|
|
|---|---|---|
| Article Number | A143 | |
| Number of page(s) | 12 | |
| Section | Interstellar and circumstellar matter | |
| DOI | https://doi.org/10.1051/0004-6361/201015381 | |
| Published online | 17 March 2011 | |
Detection of very-high-energy γ-ray emission from the vicinity of PSR B1706–44 and G 343.1–2.3 with H.E.S.S.
1 Max-Planck-Institut für Kernphysik, PO Box 103980, 69029 Heidelberg, Germany ;
e-mail: This email address is being protected from spambots. You need JavaScript enabled to view it.
2
Yerevan Physics Institute, 2 Alikhanian Brothers St., 375036 Yerevan, Armenia
3
Centre d’Étude Spatiale des Rayonnements, CNRS/UPS, 9 Av. du Colonel Roche, BP 4346, 31029 Toulouse Cedex 4, France
4
Universität Hamburg, Institut für Experimentalphysik, Luruper Chaussee 149, 22761 Hamburg, Germany
5
Institut für Physik, Humboldt-Universität zu Berlin, Newtonstr. 15, 12489 Berlin, Germany
6
LUTH, Observatoire de Paris, CNRS, Université Paris Diderot, 5 Place Jules Janssen, 92190 Meudon, France
7
CEA Saclay, DSM/IRFU, 91191 Gif-Sur-Yvette Cedex, France
8
University of Durham, Department of Physics, South Road, Durham DH1 3LE, UK
9
Unit for Space Physics, North-West University, Potchefstroom 2520, South Africa
10
Laboratoire Leprince-Ringuet, Ecole Polytechnique, CNRS/IN2P3, 91128 Palaiseau, France
11
Laboratoire d’Annecy-le-Vieux de Physique des Particules, Université de Savoie, CNRS/IN2P3, 74941 Annecy-le-Vieux, France
12 Astroparticule et Cosmologie (APC), CNRS, Université Paris 7 Denis Diderot, 10 rue Alice Domon et Léonie Duquet, 75205 Paris Cedex 13 ; UMR 7164 (CNRS, Université Paris VII, CEA, Observatoire de Paris, France )
13 Dublin Institute for Advanced Studies, 5 Merrion Square, Dublin 2, Ireland
14
Landessternwarte, Universität Heidelberg, Königstuhl, 69117 Heidelberg, Germany
15
Laboratoire de Physique Théorique et Astroparticules, Université Montpellier 2, CNRS/IN2P3, CC 70, Place Eugène Bataillon, 34095 Montpellier Cedex 5, France
16
Universität Erlangen-Nürnberg, Physikalisches Institut, Erwin-Rommel-Str. 1, 91058 Erlangen, Germany
17
Laboratoire d’Astrophysique de Grenoble, INSU/CNRS, Université Joseph Fourier, BP 53, 38041 Grenoble Cedex 9, France
18
Institut für Astronomie und Astrophysik, Universität Tübingen, Sand 1, 72076 Tübingen, Germany
19
LPNHE, Université Pierre et Marie Curie Paris 6, Université Denis Diderot Paris 7, CNRS/IN2P3, 4 Place Jussieu, 75252 Paris Cedex 5, France
20 Charles University, Faculty of Mathematics and Physics, Institute of Particle and Nuclear Physics, V Holešovičkách 2, 180 00 Prague 8, Czech Republic
21
Institut für Theoretische Physik, Lehrstuhl IV: Weltraum und Astrophysik, Ruhr-Universität Bochum, 44780 Bochum, Germany
22 University of Namibia, Department of Physics, Private Bag 13301, Windhoek, Namibia
23
Obserwatorium Astronomiczne, UniwersytetJagielloński, ul. Orla 171, 30-244 Kraków, Poland
24
Nicolaus Copernicus Astronomical Center, ul. Bartycka 18, 00-716 Warsaw, Poland
25
School of Physics & Astronomy, University of Leeds, Leeds LS2 9JT, UK
26
School of Chemistry & Physics, University of Adelaide, 5005 Adelaide, Australia
27
Toruń Centre for Astronomy, Nicolaus Copernicus University, ul. Gagarina 11, 87-100 Toruń, Poland
28
Instytut Fizyki Ja¸drowej PAN, ul. Radzikowskiego 152, 31-342 Kraków, Poland
29
Astronomical Observatory, The University of Warsaw, Al. Ujazdowskie 4, 00-478 Warsaw, Poland
30
Institut für Astro- und Teilchenphysik, Leopold-Franzens-Universität Innsbruck, 6020 Innsbruck, Austria
31
Oskar Klein Centre, Department of Physics, Stockholm University, Albanova University Center, 10691 Stockholm, Sweden
32
Oskar Klein Centre, Department of Physics, Royal Institute of Technology (KTH), Albanova, 10691 Stockholm, Sweden
33
Department of Physics and Astronomy, The University of Leicester, University Road, Leicester, LE1 7RH, UK
35 National Academy of Sciences of the Republic of Armenia, Yerevan
36
Université Bordeaux 1; CNRS/IN2P3; Centre d’Études Nuclaires de Bordeaux Gradignan, UMR 5797, Chemin du Solarium, BP120, 33175 Gradignan, France
37
Instituto de Astronomia y Fisica del Espacio (CONICET-UBA), Buenos Aires, Argentina
Received: 12 July 2010
Accepted: 28 November 2010
Abstract
The γ-ray pulsar PSR B1706−44 and the adjacent supernova remnant (SNR) candidate G 343.1−2.3 were observed by H.E.S.S. during a dedicated observation campaign in 2007. As a result of this observation campaign, a new source of very-high-energy (VHE; E > 100 GeV) γ-ray emission, H.E.S.S. J1708−443, was detected with a statistical significance of 7σ, although no significant point-like emission was detected at the position of the energetic pulsar itself. In this paper, the morphological and spectral analyses of the newly-discovered TeV source are presented. The centroid of H.E.S.S. J1708−443 is considerably offset from the pulsar and located near the apparent center of the SNR, at αJ2000 = 17h08m11s ± 17s and δJ2000 = −44°20′ ± 4′. The source is found to be significantly more extended than the H.E.S.S. point spread function (~0.1°), with an intrinsic Gaussian width of 0.29° ± 0.04°. Its integral flux between 1 and 10 TeV is ~ 3.8 × 10⁻¹² ph cm-2 s-1, equivalent to 17% of the Crab Nebula flux in the same energy range. The measured energy spectrum is well-fit by a power law with a relatively hard photon index Γ = 2.0 ± 0.1stat ± 0.2sys. Additional multi-wavelength data, including 330 MHz VLA observations, were used to investigate the VHE γ-ray source’s possible associations with the pulsar wind nebula of PSR B1706−44 and/or with the complex radio structure of the partial shell-type SNR G 343.1−2.3.
Key words: ISM: individual objects: G 343.1−2.3 / gamma rays: general / pulsars: individual: PSR B1706 − 44
Supported by CAPES Foundation, Ministry of Education of Brazil.
European Associated Laboratory for Gamma-Ray Astronomy, jointly supported by CNRS and MPG
© ESO, 2011
1. Introduction
The energetic pulsar PSR B1706−44 (also PSR J1709−4429) is one of the first pulsars from which pulsed emission was detected not only in the radio (Johnston et al. 1992) and in X-rays (Gotthelf et al. 2002), but also in high-energy (HE; E ~ GeV) γ-rays (Swanenburg et al. 1981). The pulsar was first detected in a high-frequency radio survey by Johnston et al. (1992) and has a spin period P = 102 ms, a characteristic age τc = 17 500 yr, and a spin-down luminosity Ė = 3.4 × 1036 erg s-1. It belongs to the class of relatively young and powerful pulsars, of which the Vela Pulsar is the most prominent example in the southern hemisphere. The putative wind nebulae of these pulsars are prime candidates for being sources of very-high-energy (VHE; E > 100 GeV) γ-rays. A bright, HE γ-ray source, 2CG 342−02, was discovered by the COS-B satellite (Swanenburg et al. 1981) and later found to be positionally coincident with the radio pulsar. The γ-ray source was firmly associated with PSR B1706−44 after EGRET (the Energetic Gamma Ray Experiment Telescope, onboard the Compton Gamma-Ray Observatory) observed pulsations from 3EG J1710−4439 (also EGR J1710−4435) which matched the period seen in the radio waveband (Thompson et al. 1992). More recently, the pulsar has been detected at GeV energies by the latest generation of spaceborne HE γ-ray detectors: by AGILE (Astrorivelatore Gamma ad Immagini LEggero) as 1AGL J1709−4428 (Pittori et al. 2009) and by the Fermi/LAT (Large Area Telescope) as 1FGL J1709.7−4429 (Abdo et al. 2010).
Radio observations of PSR B1706−44 reveal the presence of a synchrotron nebula, with an extension of ~ 3′, surrounding the pulsar (Frail et al. 1994; Giacani et al. 2001). The observed polarization and the flat spectrum, with a flux density spectral slope α = 0.3 (where the flux density S ∝ ν − α), suggest it is a pulsar wind nebula (PWN). However, the implied conversion efficiency from spin-down energy to radio flux of ~2 × 10⁻⁶ would be the lowest of any known radio PWN (Giacani et al. 2001). Observations by the X-ray telescopes onboard ROSAT (Roentgen Satellite) and ASCA (Advanced Satellite for Cosmology and Astrophysics) reveal that the nebula is also visible in X-rays (Finley et al. 1998). The morphology of the PWN was mapped in detail at arcsecond scales utilizing the superior resolution of the Chandra X-ray Observatory (Romani et al. 2005). The X-ray analyses suggest the presence of a diffuse X-ray PWN, with a spectral index of 1.77, which surrounds a more complex structure consisting of a torus and inner and outer jets. The diffuse X-ray PWN has a radius of 1.8′ and also exhibits a fainter, longer extension to the West. The presence of non-deformed X-ray jets is consistent with the pulsar’s low apparent speed, v = 89 km s-1, as deduced from scintillation measurements (Johnston et al. 1998).
The pulsar PSR B1706−44 is also located at the southeast end of an incomplete arc of radio emission (McAdam et al. 1993), which has been suggested to be the partial shell of a faint supernova remnant (SNR G 343.1−2.3). The arc is embedded in weak diffuse radio emission, which is present both inside and outside of the arc (Frail et al. 1994). Polarization measurements suggest that this diffuse emission is associated with synchrotron radiation from the SNR itself (Dodson & Golap 2002). The SNR has not been detected in any other waveband (see e.g. Becker et al. 1995; Aharonian et al. 2005a). There are various estimates of the distance to the pulsar, ranging from 1.8 kpc (Johnston et al. 1992; Taylor & Cordes 1993) to 3.2 kpc (Koribalski et al. 1995). The distance 2.3 ± 0.3 kpc, derived from the dispersion measure and the most recent Galactic free electron distribution model (Cordes & Lazio 2002), is adopted throughout this paper. This distance is compatible with the less reliable Σ − D distance of ~ 3 kpc for the SNR (McAdam et al. 1993).
The possible physical association between PSR B1706−44 and G 343.1−2.3 has been questioned based on the differing age and distance estimates for the SNR and pulsar (see Sects. 4.2 and 4.3, respectively) and the lack of visible interaction. Furthermore, if the pulsar originated at the apparent center of the SNR, then its inferred velocity (~700 km s-1) is incompatible with its scintillation velocity (89 km s-1). Bock & Gvaramadze (2002) suggested a scenario where an off-center cavity explosion could relax the restrictions on the inferred velocity and invalidate the age estimate for the SNR of ~ 5000 yr (McAdam et al. 1993), which is based on a Sedov-Taylor model. In this scenario, PSR B1706−44 and G 343.1−2.3 are physically associated; however, the radio arc is not identified with the SNR shell, but rather with the former boundary of the wind-blown cavity that was overtaken and compressed by the expanding SNR (Dodson & Golap 2002).
Summary of the efforts to observe PSR B1706−44 in the VHE γ-ray domain.
In the VHE domain, both the pulsar and the SNR have been observed using ground-based, imaging atmospheric-Cherenkov telescopes (IACTs). The findings of the various observations are, however, not fully consistent (see Table 1). The CANGAROO (Collaboration of Australia and Nippon (Japan) for a Gamma Ray Observatory in the Outback) Collaboration reported the detection of steady emission, coincident with the pulsar, using the 3.8 m CANGAROO-I telescope in 1992–1993 (Kifune et al. 1995). They measured an integral flux F(≳ 1 TeV) ≈ 1 × 10-11 ph cm-2 s-1, equivalent to ~ 44% of the Crab Nebula flux1. However, the CANGAROO Collaboration recently undertook a comprehensive re-analysis of their archival CANGAROO-I data and no longer find a signal; instead, they calculate an upper limit (UL; here, at 95% confidence level and assuming a spectral index of −2.5) to the integral flux of F(≳ 3.2 TeV) < 8.0 × 10⁻¹³ ph cm-2 s-1 (~24% Crab) (Yoshikoshi et al. 2009). The 4-m BIGRAT (BIcentinnial Gamma RAy Telescope) telescope (Rowell et al. 1998) also observed the pulsar in 1993–1994 and reported a compatible UL. Observations in 1996 with the Durham Mark 6 telescope (Chadwick et al. 1998) appeared to confirm the earlier CANGAROO-I detection, with a reported integral flux that was compatible within the large systematic uncertainties (± 30% for CANGAROO-I and ± 50% for the Mark 6). Further observations with the CANGAROO-II telescopes in 2000–2001 again seemed to validate the detection (Kushida et al. 2003). However, when the H.E.S.S. (High Energy Stereoscopic System) Collaboration observed the pulsar in 2003 during its commissioning phase, they did not detect any significant VHE γ-ray emission from PSR B1706−44 or its vicinity. The derived UL (99% confidence level) on the integral flux from an extended region encompassing the SNR was found to be F(> 0.5 TeV) < 3.5 × 10⁻¹² ph cm-2 s-1 (~5% Crab) (Aharonian et al. 2005a), in stark disagreement with all of the previous findings (see also the Appendix). Shortly thereafter, preliminary analysis of stereo observations with the 4 × 10-m CANGAROO-III telescope array also disagreed with the initial CANGAROO-I detection and resulted in an UL at the pulsar position (95% confidence level) of F(≳ 0.6 TeV) ≲ 5 × 10-12 ph cm-2 s-1 (~10% Crab) (Tanimori et al. 2005), which agreed with the H.E.S.S. results at the time.
In 2007, H.E.S.S. followed up on their initial result by carrying out additional dedicated observations of the pulsar, now utilizing the superior sensitivity of the fully-operational H.E.S.S. telescope array. This campaign resulted in the discovery of extended emission from the vicinity of PSR B1706−44 and G 343.1−2.3, with preliminary results published in Hoppe et al. (2009). The latest results from CANGAROO-III also indicate the presence of an extended source of VHE γ-ray emission from the vicinity of the pulsar, although the spectrum and morphology of the emission vary considerably depending on the method used for background subtraction (Enomoto et al. 2009). For example, integrating within 1.0° of the pulsar position and using an ON-OFF background method (see Sect. 2.3), they find a Crab Nebula-level integral flux. In this paper, we present new VHE data on PSR B1706−44 and G 343.1−2.3 which was obtained during H.E.S.S.’s 2007 observational campaign.
2. H.E.S.S. observations and analysis
Event statistics for Regions A, B, and C.
2.1. The H.E.S.S. telescope array
H.E.S.S. is an array of four IACTs, dedicated to the observation of VHE γ-rays. The array has been operating since December 2003 in the Khomas Highlands of Namibia; its location in the southern hemisphere (23°16′17″ S) allows observations of the inner Galaxy at reasonably low zenith angles. Each telescope is equipped with a tessellated, spherical mirror with a total area of 107 m2 and a camera comprised of 960 photomultiplier tubes, covering a field-of-view (FoV) 5° in diameter. The telescopes are situated on a square with sides of 120 m length and operated in stereo trigger mode (Funk et al. 2004), which requires at least two telescopes to trigger the detection of an extensive air shower (EAS). This stereoscopic approach results in an angular resolution ≲ 0.1° per event, an energy resolution of ~15% (on average), and an improved background rejection (Aharonian et al. 2006a). The H.E.S.S. array can detect point sources near zenith at flux levels of ~1% of the Crab Nebula flux with a statistical significance of 5σ in 25 h of observations, or less if advanced techniques are used for EAS image analysis (Acero et al. 2009). Its large FoV and off-axis sensitivity not only make it ideally suited for surveying the Galactic Plane (Aharonian et al. 2005b, 2006c; Chaves et al. 2008), but also for studying extended sources like H.E.S.S. J1708−443.
2.2. VHE γ-ray observations
The region of interest, which includes PSR B1706−44 and SNR G 343.1−2.3, was observed with the full four-telescope H.E.S.S. array in 2007. The observations were dedicated to search for VHE γ-ray emission from the pulsar and were therefore taken in wobble mode centered on its position in the radio (αJ2000 = 17h09m42.73s, δJ2000 = −44°29′08.2″; Wang et al. 2000). In this observation mode, the array is pointed toward a position offset from the source of interest to allow simultaneous background estimation. Observations of 28-min duration were taken, alternating between offsets of ± 0.7° in declination and right ascension. After standard quality selection (Aharonian et al. 2006a) to remove data affected by unstable weather conditions or hardware-related problems, the total live-time of the dataset is ~ 15 h. The zenith angle of the observations ranges from 20° to 30°, with a mean of 24°. We only use data from the 2007 observations of PSR B1706−44, because at that time the full four-telescope array was in operation along with the central stereo trigger system, resulting in a higher sensitivity compared to earlier observations in 2003 (Aharonian et al. 2005a) when H.E.S.S. was in its commissioning phase, with only two telescopes and no central trigger (see also the Appendix).
2.3. Analysis methods
The dataset was analyzed using the Hillas second moment method (Hillas 1985) and the H.E.S.S. standard analysis described in Aharonian et al. (2006a). For γ-hadron separation, hard cuts were used, which require a minimum of 200 photoelectrons (p.e.) to be recorded per EAS image. Compared to standard cuts (80 p.e.), this relatively strict requirement results in better background rejection and an improved angular resolution but also in an increased energy threshold (560 GeV for this dataset). The time-dependent optical response of the system was estimated from the Cherenkov light of single muons passing close to the telescopes (Bolz 2004). Three different background estimation procedures (Berge et al. 2007) were used in this analysis.
For 2D image generation, the ring background method (Berge et al. 2007) was used with a mean ring radius of 0.85°. Since this method includes an energy-averaged model for the camera acceptance to account for the different offsets of the signal and background regions from the camera center, it was not used for spectral extraction. The reflected region background method (Berge et al. 2007) was instead used to measure the flux from the pulsar position.
Since the observations of PSR B1706−44 were performed in wobble mode (see Sect. 2.2), half are actually pointed inside the extended emission from H.E.S.S. J1708−443, which was not known to exist at that time. Therefore, for spectral extraction from extended regions which also enclose the pointing positions of the telescopes, the background was estimated using the ON-OFF background method (Berge et al. 2007), where off-source (OFF) data is taken from extragalactic regions of the sky where no γ-ray sources are known. To match the observing conditions between on-source (ON) and OFF data, the two observations had to be taken within six months of each other and at similar zenith angles. The ON-OFF background method was also used for the analysis of Vela Junior (Aharonian et al. 2005c). The normalization between ON and OFF observations (Berge et al. 2007) was calculated from the total event number in the two observations, excluding regions with significant VHE γ-ray signal. The background is thus normalized in an approximately ring-shaped region (depicted in Fig. 3) with inner radius 1.0° and outer radius 2.5°, excluding a small region which overlaps the known source H.E.S.S. J1702−420 (Aharonian et al. 2008). With this background normalization, the analysis is obviously only sensitive to a localized excess of γ-rays but not to emission which would be more or less uniform across the entire H.E.S.S. FoV.
3. Results
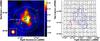 |
Fig. 1 Left: image of the VHE γ-ray excess (in units of γ-rays arcmin-2) from H.E.S.S. J1708−443, smoothed with a 2D Gaussian with a width σ = 0.10°. The blue-to-red color transition is chosen to reduce the appearance of features which are not statistically significant. The white cross is located at the best-fit position of the center-of-gravity of the emission and its size represents the statistical error of the fit. The small and large dotted white circles, labeled A and C, respectively, denote the regions used for spectral analysis. The a priori defined Region B, from which the detection significance was calculated, is represented by a dotted green circle. The three regions are summarized in Table 2. The position of the pulsar PSR B1706−44, at the center of region A, is marked by a square. The inset (bottom-left corner) shows the point-spread function of the H.E.S.S. telescope array for this particular dataset, smoothed in the same manner as the excess image. Radio contours of constant intensity, as seen at 330 MHz with the Very Large Array (VLA), are shown in green. The radio data were smoothed with a Gaussian of width σ = 0.03°. The local maximum in the radio contours at the center of the image is largely due to PMN J1708−4419, an extragalactic object seen in projection (see Sect. 4.3). Right: gamma-ray excess in quadratic bins of 0.175° width. The upper number in each bin is the excess summed within this bin, and the lower number is the corresponding statistical error. The blue contours correspond to a smoothed excess of 0.14, 0.17, and 0.21 γ-rays arcmin-2, taken from the image on the left. The red-rimmed bin is centered on the pulsar position. Note the different field-of-view used in the two figures. |
Two different circular regions were defined a priori in order to reduce the number of trials during a search for statistically-significant VHE γ-ray emission. Since other IACTs have reported point-like emission from the pulsar position, one of these regions, hereafter Region A, is centered at this position and has a radius of 0.10°, which is the standard radius used to search for point sources in the H.E.S.S. standard analysis. The second region, hereafter Region B, is identical to the region referred to as the Radio arc in Aharonian et al. (2005a); it is centered at the approximate apparent center of the radio arc (αJ2000 = 17h08m, δJ2000 = −44°16′48″; as defined in Aharonian et al. 2005a) and has a radius of 0.60° in order to enclose the entire radio structure.
No statistically-significant emission is observed from the pulsar position (Region A); therefore, an upper limit of 14.8 excess γ-ray events is calculated at a 99% confidence level, following the unified approach of Feldman & Cousins (1998). From Region B, however, a clear signal is detected with 543 excess γ-rays and a significance of 7.0σ. The measured signal corresponds to a flux ~13% that of the Crab Nebula above 0.6 TeV. Table 2 summarizes the event statistics for Regions A and B.
Figure 1 (left) presents an image of the VHE γ-ray excess in the 2° × 2° region around the source, smoothed with a Gaussian of width 0.09° to reduce statistical fluctuations. The smoothing radius is chosen to be on the same scale as the H.E.S.S. point-spread function (PSF; 68% containment radius ~0.1°), so that resolvable morphological features are largely maintained. The emission clearly extends beyond the PSF, which is depicted in the lower left inlay of Fig. 1 (left). Figure 1 (right) shows the number of excess events within the emission region along with their statistical errors, in quadratic bins of 0.175° width, without smoothing. This figure demonstrates that the current statistics do not permit a detailed study of the source morphology. However, the lack of a significant VHE γ-ray excess at the position of the pulsar is clear in both figures.
The centroid of the new H.E.S.S. source is determined by fitting the unsmoothed γ-ray excess image with a radially-symmetric Gaussian profile (φ = φ0 e − r2/(2σ2)) convolved with the H.E.S.S. PSF (0.07° for this analysis). The centroid of the best fit is at αJ2000 = 17h08m11s ± 17s and δJ2000 = −44°20′ ± 4′ (ℓ ~ 343.06°,b ~ −2.38°). The pointing precision of the H.E.S.S. telescope array is 20″ (Gillessen et al. 2005), which adds an additional systematic uncertainty. The combined errors are reflected in the size of the cross in Fig. 1 (left). Consequently, the new VHE γ-ray source is designated H.E.S.S. J1708−443. The fit also gives the source’s intrinsic Gaussian width σ = 0.29° ± 0.04°stat.
Spectral analyses were performed for two regions, Region A, which was introduced above, and Region C, which is centered on the centroid (i.e. best-fit position) and has a radius of 0.71° (see Table 2). The size of Region C represents an ~95% enclosure of the excess, chosen as a compromise between an optimal signal-to-noise ratio and independence of source morphology. Both regions are indicated by dashed circles in Fig. 1 (left). From Region A, an integral flux limit of F(> 0.6 TeV) < 3.3 × 10⁻¹³ ph cm-2 s-1 was derived with a 99% confidence level according to Feldman & Cousins (1998), assuming that the underlying γ-ray spectrum follows a power law with photon index Γ = 2.5, an index close to that of the Crab Nebula (Aharonian et al. 2006a). This upper limit corresponds to ~ 1% of the flux of the Crab Nebula in the same energy range.
The energy spectrum of the entire source is extracted from Region C. Within the large integration circle, 615 excess γ-ray events were found, corresponding to a statistical significance of 6.8σ (pre-trials). The differential spectrum (Fig. 2) is well-described by a power law φ = φ0 (E/1 TeV)−Γ with a spectral photon index Γ = 2.0 ± 0.1stat ± 0.2sys and a flux normalization at 1 TeV of φ0 = (4.2 ± 0.8stat ± 1.0sys) × 10-12 cm-2 s-1 TeV-1. The integral flux F(1–10 TeV) = 3.8 × 10⁻¹² ph cm-2 s-1 is ~17% of the Crab Nebula flux in the same energy range. The extracted flux points from the extended emission and the fitted power law are shown in Fig. 2. The results presented above have been cross-checked, using an independent calibration of the raw data and an alternative analysis chain. The cross-checks included a spectral analysis using the reflected region background method (Berge et al. 2007), which requires observations to be centered outside of the emissive region and thus used only half of the available dataset. All cross-checks confirmed the primary results within the stated statistical uncertainties.
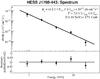 |
Fig. 2 Differential energy spectrum of H.E.S.S. J1708−443, extracted from Region C (see Table 2). The solid line shows the result of a power-law fit. The error bars denote 1-σ statistical errors. The bottom panel shows the residuals of the power-law fit. Events with energies between 0.6 and 28 TeV were used in the determination of the spectrum, and the minimum significance per bin is 1σ. |
The most recent observations and analysis by CANGAROO-III also give an indication of extended emission in the vicinity of PSR B1706−44 (Enomoto et al. 2009). However, their results differ significantly from those given in this paper. For example, the morphology of the VHE γ-ray excess reported by Enomoto et al. (2009), using an ON-OFF background technique, is that of a source centered roughly at the pulsar position, as opposed to H.E.S.S. J1708−443, whose centroid is clearly offset from the pulsar. Furthermore, CANGAROO-III measures a Crab Nebula-level integral flux (above 1 TeV) within 1.0° of the pulsar, which is inconsistent with the ~18% Crab flux measured by H.E.S.S. in the same energy range. The difference is possibly due to the exact methods used for background subtraction; in the H.E.S.S. analysis, the OFF data are normalized to source-free regions of the ON data, because the background can vary significantly depending on the observing conditions.
4. Origin of the VHE γ-ray emission
While a superposition of a relic PWN created by PSR B1706−44 and SNR G 343.1−2.3 cannot be excluded, each of these objects individually could account for the observed VHE γ-ray emission. The possible associations with H.E.S.S. J1708−443 will be discussed in the following sections and both leptonic and hadronic scenarios will be considered.
4.1. A Relic Nebula from PSR B1706–44
The pulsar PSR B1706−44, which has a high spin-down luminosity Ė = 3.4 × 1036 erg s-1, is energetic enough to power the observed VHE γ-ray emission, which has a luminosity between 1 and 10 TeV of Lγ ≈ 9.9 × 1033(D/2.3 kpc)2 erg s-1. The apparent conversion efficiency from rotational energy to γ-rays in this energy range can be defined as ϵ1−10 TeV ≡ Lγ/Ė and for this case is ~0.3%, compatible with the efficiencies (≲ 10%) of other VHE γ-ray sources which have well-established associations with PWNe (Gallant 2007). The projected size of H.E.S.S. J1708−443 corresponds to a physical size of ~12 (D/2.3kpc) pc (68% containment radius). These characteristics suggest a possible association between the VHE γ-ray emission and the PWN of PSR B1706−44, similar to other PWN/VHE associations, e.g. Vela X (Aharonian et al. 2006b) and H.E.S.S. J1825−137 (Aharonian et al. 2006d).
In a leptonic scenario, the VHE γ-radiation originates from accelerated electrons which up-scatter ambient photons to VHE γ-ray energies via inverse Compton (IC) scattering. Compared to the size of the PWN in the radio (radius ~ 1.5′) (Giacani et al. 2001) and the “bubble” nebula seen in X-rays (radius ~ 1.8′) (Romani et al. 2005), the VHE γ-ray PWN (sometimes referred to as a TeV PWN) would be a factor of ~10 larger. Similar differences in size have been observed in other TeV PWN associations, e.g. H.E.S.S. J1825−137 (Aharonian et al. 2006d), and can be explained by the different energies, and hence cooling times, of the electrons which emit the X-rays and VHE γ-rays. Assuming the magnetic field is uniform and that the average wind convection speeds in the γ-ray and X-ray emitting zones are both constant and similar, Aharonian et al. (2005d) estimate the ratio of sizes 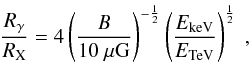 (1)where EkeV is the mean energy in X-rays (2 keV) and ETeV is the mean energy in VHE γ-rays (0.9 TeV). However, in contrast to the PWN of PSR J1826−1334, where a magnetic field strength B = 10 μG was inferred from X-ray observations (Gaensler et al. 2003), Romani et al. (2005) estimated a magnetic field B as strong as 140
 μG within the 110″ radius X-ray PWN of PSR B1706−44, assuming the spectral break between the extrapolation of radio and X-ray spectra is due to radiative cooling of electrons. In such a high magnetic field, electrons that emit keV X-rays have comparable energies to those that emit TeV γ-rays and therefore have comparable cooling times as well. Thus, the TeV PWN should be approximately the same size as the X-ray PWN, i.e. it should appear point-like considering the ~ 5′ H.E.S.S. PSF. Furthermore, given that the ratio of X-ray to VHE γ-ray energy flux is determined by the energy density in magnetic fields and IC target photon fields (only the cosmic microwave background (CMB) is considered here),
 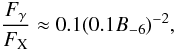 (2)where B = 10-6B-6 G (Aharonian et al. 1997), the observed X-ray flux FX = 3.3 × 10⁻¹³ erg cm-2 s-1 at EkeV = 1.2 keV (Becker et al. 1995) can be used to predict the γ-ray flux Fγ at
 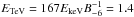 TeV (de Jager & Djannati-Ataï 2008) assuming the value of B estimated by Romani et al. (2005). This results in a predicted Fγ(1.4 TeV) = 1.7 × 10⁻¹⁶ erg cm-2 s-1, well below the level observable by H.E.S.S. Conversely, the absence of VHE γ-rays from the compact nebula (cf. H.E.S.S. UL from Region A in Sect. 3) can be used together with FX to calculate a lower limit on the magnetic field using Eq. (2). The resulting limit, B ≳ 2.5 μG, is consistent with the magnetic field estimated by Romani et al. (2005).
One way to reconcile the difference in emission region size and the high flux of the VHE γ-ray emission is to assume that the size of the X-ray PWN is primarily governed by the extent of the high B-field region and that the magnetic field decreases by a large factor beyond the X-ray PWN. The electrons can then escape from the high B-field region and, by accumulating over a significant fraction of the lifetime of the pulsar, form a larger nebula which is visible only in VHE γ-rays. The synchrotron cooling time of electrons that up-scatter CMB photons to energies Eγ is given by 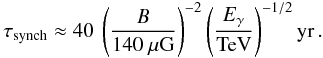 (3)In the 140 μG field inside the X-ray PWN, the cooling time of up-scattered electrons producing 1 TeV γ-rays is ~ 40 yr. Assuming a dominantly advective, rather than diffusive, transport process, the average flow speed needed to drive electrons from the pulsar position to the edge of the X-ray PWN (r ≈ 110″) within 40 yr is 0.1(D/2.3 kpc) c. The implied flow speed is reasonable following the arguments of Kennel & Coroniti (1984), although their model considers the case of the symmetric Crab Nebula, which is admittedly a simplification of the asymmetric PWN considered here. If the magnetic field within the X-ray PWN was much higher than 140 μG in the past, when most of the electrons were emitted, the restrictions on the flow speed would become more stringent. However, in the low B-field region outside the X-ray PWN, the synchrotron lifetime increases. Even for a magnetic field strength of 10 μG, a value about three times as large as the interstellar magnetic field, the cooling time of the aforementioned electrons is about 8 000 yr, almost half of the characteristic age of the pulsar (17 500 yr).
This relic TeV PWN scenario does not, however, explain the asymmetric morphology of H.E.S.S. J1708−443, in particular its offset from the pulsar location, nor does it explain the lack of detectable VHE γ-ray radiation from the location of the pulsar itself, assuming that the pulsar and X-ray PWN are embedded in an extended shell of relic electrons. Such asymmetries have been observed previously in other TeV PWNs, e.g. H.E.S.S. J1718−385, H.E.S.S. J1809−193 (Aharonian et al. 2007a) and H.E.S.S. J1825−137 (Aharonian et al. 2005d, 2006d). These asymmetries could be accounted for in two ways: as a direct result of a high proper motion of the pulsar or as a result of a density gradient in the ambient medium. The density gradient could lead to an asymmetry in the reverse shock of the supernova, or it could lead to a different expansion velocity for the TeV γ-ray emitting electrons (Blondin et al. 2001; van der Swaluw et al. 2001). Simulations by van der Swaluw et al. (2001) demonstrate that a displaced PWN can indeed be well-separated from its pulsar. These explanations are in principle applicable to the case of H.E.S.S. J1708−443; however, the pulsar’s measured scintillation velocity, less than 100 km s-1, renders the first explanation unlikely. The latter explanation favors a TeV PWN which is offset toward a low density region. The available H i line emission data (see Fig. 4 (left) and the subsequent section) suggest that this might be the case, although it is not clear given the complex H i morphology.
In the preceeding discussion, it was assumed that the pulsar dominantly accelerates electrons. If a considerable fraction of the accelerated particles are instead hadrons (e.g. Horns et al. 2006; Amato et al. 2003; Bednarek & Bartosik 2003), the constraints imposed by the large magnetic field within the X-ray PWN are removed. In a hadronic scenario, π0 mesons are produced by inelastic interactions between accelerated protons and the ambient gas; they then decay, emitting VHE γ-ray photons. In such a scenario, the VHE γ-ray emission would trace the distribution of the target material. The bright radio arc, interpreted by Bock & Gvaramadze (2002) as the compressed outer boundary of the former wind-blown bubble, could act as such a target due to its enhanced density, thereby also explaining the spatial coincidence with the H.E.S.S. source. Since the proton interaction time is long compared to the age of the pulsar, and assuming that the escape of protons from the region is sufficiently slow, all protons accelerated since the birth of the pulsar can contribute to the γ-ray emission. However, to account for the high luminosity of the VHE γ-ray emission, the pulsar must have a high rotational energy and must efficiently convert rotational energy into proton acceleration. The total energy in accelerated protons Wp in the energy range 10–100 TeV which is necessary to produce the observed γ-ray luminosity Lγ can be estimated from the relation  (4)where τγ ≈ 5 × 10¹⁵(n/cm-3)-1 s is the characteristic cooling time of protons through the π0 production channel. The total energy within the entire proton population WP(tot) ≈ 3 × 1049 erg(n/cm-3)-1(D/2.3 kpc)2 is then estimated by extrapolating the proton spectrum down to 1 GeV assuming the same spectral shape as the VHE γ-ray spectrum, i.e. a power law with index Γ = 2.0. Assuming that a fraction η of the pulsar’s rotational energy Erot is converted into the energy within the proton population WP(tot) = η Erot, then
 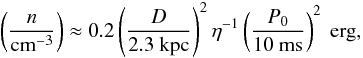 (5)where
  and I ≈ 1 × 1045 g cm2 is the moment of inertia of the pulsar. For a distance D = 2.3 kpc and an efficiency η = 0.3, the initial rotation period P0 has to be as small as 6–12 ms for the ambient medium density to be in the range n ≈ 1–5 cm-3. Although pulsars are thought to be born with initial periods which are considerably shorter than their present periods, the initial rotation period implied for PSR B1706−44, in the above hadronic TeV PWN scenario, is even smaller than that of the Crab pulsar, the only case for which P0 is well-determined (19 ms) (Manchester & Taylor 1977).
 |
Fig. 3 Large field-of-view (FoV; 5.1° × 5.1°) VHE γ-ray image of the region containing H.E.S.S. J1708−443. The Gaussian-smoothed (σ = 0.10°) VHE γ-ray excess from Fig. 1 (left) is shown in color. The white contours indicate the intensity of the 330 MHz radio emission detected with Very Large Array (VLA) observations (see also the green contours in Fig. 1, left). The dotted white box represents the FoV covered by the VLA observations. Outside of this region, green contours indicate the lower-resolution 2.4 GHz radio continuum data (Duncan et al. 1995) taken with the Parkes telescope; these observations have a half-power beamwidth of ~ 10.4′. This image also shows the approximately ring-shaped region used for normalizing the background in the ON-OFF background method (see Sect. 2.3); this region is delimited by the large dashed white circles, excluding the known TeV source H.E.S.S. J1702−420 located toward the Northwest. The Galactic plane is also located toward the NW and is indicated by a thick black dotted line. |
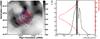 |
Fig. 4 Left: the grey-scale image shows the intensity of H i line emission in units of K km s-1, measured by the Parkes radio telescope during the Southern Galactic Plane Survey (SGPS) (McClure-Griffiths et al. 2005). The intensities are integrated in the velocity range −13.79 km s-1 to −21.21 km s-1 (shown as a shaded region in the velocity profile, right), corresponding to a near/far kinematic distance of 1.6–2.3 kpc/13.0–13.7 kpc. Contours of the Gaussian-smoothed (σ = 0.10°) VHE γ-ray excess are shown in blue. The red contours depict the intensity of the radio emission measured by the Very Large Array (VLA) at 330 MHz (see also Fig. 1 left). The radio data have been smoothed with σ = 0.03°. The white circle illustrates the integration region for the velocity profile shown on the right. Right: velocity profile of H i line emission intensity, integrated over the region enclosed by the dashed circle on the left. The velocity resolution is 0.08 km s-1. The kinematic distance, shown in red, is derived from the velocity using the Galactic rotation curve of Fich et al. (1989). |
The hadronic PWN scenario is further disfavored by constraints on the proton escape time. Under the common assumption that the proton diffusion coefficient is energy-dependent, i.e. 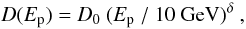 (6)with a power-law index δ ≈ 0.5, where D0 is the diffusion coefficient at 10 GeV, one can estimate D0 required to contain protons with energy Ep = 100 TeV within a certain distance of the pulsar after t = τc, since the diffusion radius
  for timescales less than the proton energy loss time, t ≪ τγ. This containment region can be estimated to have an angular size of ~ 0.7°, which is the approximate distance between the pulsar and the farthest significant VHE γ-ray emission. At the assumed pulsar distance, this region would have a physical size of 28 (D/2.3 kpc) pc. The required diffusion coefficient D0 ≈ 3.4 × 1025 (D/2.3 kpc)2 cm2s-1 is found to be prohibitively low by a factor of 10–100 and can only be reconciled by assuming a very weak energy dependence, δ ≲ 0.2.
4.2. SNR G 343.1–2.3
The VHE γ-ray source H.E.S.S. J1708−443 is partially coincident with the bright radio arc and the surrounding diffuse emission of the SNR, visible in the 330 MHz observations taken with the VLA (see contours in Fig. 1, left, and Fig. A.2). The centroid of the H.E.S.S. source is consistent with the apparent center of the bright radio arc (αJ2000 = 17h08m, δJ2000 = −44°16′48″; as defined in Aharonian et al. 2005a). The extension of the VHE γ-ray excess (68% containment radius: 0.29° ± 0.04°) is compatible with the the radius of the radio shell (~0.27°) fit by Frail et al. (1994) using VLA observations at 90 cm. The 95% containment radius (0.71°; used for spectral extraction) of the γ-ray excess completely encloses the radio shell, whose approximate boundary was estimated at a radius of ~0.42° by Romani et al. (2005) using ATCA (Australia Telescope Compact Array) observations at 1384 MHz (Dodson & Golap 2002). Thus, while the majority of the VHE γ-ray emission is located within the radio shell, emission from the shell itself cannot be excluded. Due to low statistics in the current VHE dataset, no further conclusions can be made regarding morphological similarities. No significant VHE emission was detected from the spatially-extended, diffuse emission visible farther to the Southeast of the bright radio arc, seen in the low-resolution 2.4 GHz continuum radio data (Duncan et al. 1995) shown in Fig. 3, although the offset-corrected exposure in this region is very low (between ~4 and 10 h) since all the H.E.S.S. observations were centered near the pulsar. This diffuse radio emission was interpreted by Bock & Gvaramadze (2002) as originating from the eastern half of the expanding SNR shell, propagating into a low-density region.
Similar to the potential association with the PWN of PSR B1706−44, both leptonic and hadronic scenarios will be considered for VHE γ-ray production. The leptonic scenario suffers from the non-detection of the SNR at X-ray energies. The VHE γ-ray spectrum is hard and extends up to 20 TeV; assuming IC scattering in the Thomson regime, the electrons which up-scatter CMB photons to 20 TeV have an energy of ~80 TeV. For a reasonable magnetic field strength of 5 μG, these electrons would emit synchrotron photons with an energy of ~1 keV, i.e. photons within the detectable energy range of current X-ray telescopes. Unfortunately, this prediction cannot be tested because the X-ray UL calculated by Becker et al. (1995) using ROSAT was derived from a relatively small part of the shell; no stringent UL on the X-ray flux from an extended region within 0.7° of the H.E.S.S. source can be derived (W. Becker, pers. comm.) due to its large extension and the vicinity of the luminous low-mass X-ray binary (LMXB) 4U 1705−440 (Becker et al. 1995), whose stray light may be obscuring diffuse X-ray emission from the SNR. It is also possible that the X-ray emission is inherently weak and cannot be detected due to the relatively high interstellar absorption (Becker et al. 1995).
In the hadronic scenario, synchrotron radiation is expected only from secondary electrons, and the lack of X-ray detection can easily be accounted for. Assuming a total energy of 1051 erg is released in the supernova explosion, an acceleration efficiency of ϵ = 0.15 and a distance D = 2.3 kpc, an average proton density of n ≈ 1.5 cm-3 – a value slightly larger than the average Galactic ambient density – is sufficient to explain the previously estimated (Sect. 4.1) energy content of WP(tot) ≈ 3 × 1049 erg within the proton population.
Given the various scenarios that have been proposed to explain the origin of the bright radio arc, there are many different possibilities as to how the SNR could be associated with H.E.S.S. J1708−443. In one scenario, the SNR G 343.1−2.3 is expanding symmetrically into the interstellar medium (ISM), and the intensity variations which form the radio arc are due to local density differences in the ISM. An association between the SNR and the pulsar PSR B1706−44, a controversial scenario which is still debated in the community (see e.g. Bock & Gvaramadze 2002; Romani et al. 2005), would make the SNR rather old, O(10 000 yr), and place it in the late Sedov-Taylor phase, or, more likely, in the radiative phase. If the SNR is in the radiative phase, the ambient material swept up by the SNR should be visible in CO or H i data. Unfortunately, no high-resolution CO data are publicly available at the moment, but there is evidence for a ring-like structure in the H i line emission survey of the Parkes telescope, as shown in Fig. 4 (left). The structure is best visible in the velocity range −13.79 km s-1 to −21.21 km s-1 corresponding to a near/far kinematic distance of 1.6–2.3 kpc/13.0–13.7 kpc (Fig. 4, right). The near distance is compatible with the pulsar distance (2.3 kpc). A rough estimate of the mass of the H i structure, extracted from the circular region in Fig. 4 (left), is ~ 6 × 10³ M⊙. Assuming radial symmetry, this corresponds to an original density of the swept-up mass of a few protons cm-3, comparable to the density requirements imposed by the observed γ-ray flux. The bright radio arc and the VHE γ-ray emission spatially coincide with only one half of the H i shell-like structure. This morphology could arise because of the additional dependence of the radio and γ-ray emission on the target density, which is likely larger closer to the parent MC.
The H i shell has a radius of ~0.4°, which, assuming a distance of D = 2.3 kpc, corresponds to a physical radius of ~16 pc. Following the approaches of Cioffi et al. (1988) and Truelove & McKee (1999) and further assuming an age of 17 000 yr, a 10 M⊙ progenitor star, and an energy release of 1051 erg, the ambient density necessary to explain the size of the H i shell is n ~ 0.7 cm-3 and the resulting shock velocity is ~400 km s-1. Following Ptuskin & Zirakashvili (2005), the maximum proton energy attainable is then O(10 TeV), likely too low to explain the observed TeV emission, which extends up to 20 TeV. The spectral energy distribution (SED) of γ-rays produced in the interactions of mono-energetic protons (and subsequent decay of pions) drops sharply beyond roughly 15% of the original proton energy, see e.g. Kelner et al. (2006). Therefore, the parent proton population giving rise to the observed VHE γ-ray emission should extend up to about 100 TeV, a limit which is – as the example calculation above illustrates – increasingly difficult to explain as the age of the system increases. Indeed, the γ-ray emitting SNR shells which have been unambiguously identified so far, such as RX J1713.7−3946 (Aharonian et al. 2007b) and RX J0852.0−4622 (Aharonian et al. 2007c), are much younger (~2000 yr).
The aforementioned constraints are removed if the SNR expands first into a bubble blown by the progenitor star’s wind into the ISM. Due to the low density inside the wind-blown bubble, the velocity of the expanding shock is much higher than anticipated and protons can be accelerated to very high energies. When the shockfront reaches the outer boundary of the wind-blown bubble, the high-energy protons are released to interact with the dense environment outside of the bubble and produce VHE γ-rays in the process. In this scenario, first proposed by Bock & Gvaramadze (2002), the bright radio arc is created by the former boundary of the wind-blown bubble which has been overtaken by the expanding SNR shockfront. The offset of the pulsar position from the center of the radio arc does not hinder the association between the SNR and the pulsar, since the progenitor star, whose wind has produced the bubble, can have traversed the bubble’s boundary during its evolution, before it became a supernova. The constraints on the VHE γ-ray production imposed by the large implied age of 17 000 yr do not apply in this case since the protons now interacting within the dense ambient medium to produce γ-rays could have been accelerated in the past, when the SNR shock velocity was still high. However, this would require an extremely low diffusion coefficient (D0 ≈ 2 × 1025 cm2 s-1), similar to the case of the hadronic PWN scenario (see Sect. 4.1).
This discussion of a putative association between H.E.S.S. J1708−443 and the SNR G 343.1−2.3 is based on the assumption that the SNR and the pulsar PSR B1706−44 were created at the same time. If this assumption proves to be wrong, then very little is known about the SNR. The age estimate using a Sedov-Taylor model is about 5000 yr (McAdam et al. 1993; Nicastro et al. 1996). The younger age would further ease the proton acceleration to energies beyond 100 TeV.
To summarize, the radio emission from SNR G 343.1−2.3, which may originate from the interaction of the SNR with an ambient MC, is partially coincident with H.E.S.S. J1708−443, suggesting a plausible association which could account for at least part of the VHE γ-ray emission observed. However, the putative associations between the SNR and the pulsar or between the SNR and the shell-like structure discovered in H i suggest that the SNR is in a later evolutionary stage than other SNRs previously detected in the VHE regime.
4.3. Other nearby celestial objects
There are other celestial objects nearby, i.e. within the emission region of H.E.S.S. J1708−443, notably the LMXB 4U 1705−440 (Forman et al. 1978) and the radio source PMN J1708−4419 (Wright et al. 1994). The LMXB is a well-studied type 1 burster (Sztajno et al. 1985) located at αJ2000 = 17h08m54.46s and δJ2000 = −44°6′7.35″ (Di Salvo et al. 2005), i.e. it is offset from the centroid of the VHE emission by 0.25°. Considering this offset and the extended nature of the VHE γ-ray source, an association is highly unlikely since an X-ray binary would appear point-like to H.E.S.S. Theoretical predictions for VHE γ-ray emission from LMXBs focus on those with relativistic jets (microquasars); 4U 1705−440 does not exhibit jets. Furthermore, no LMXBs have been detected in the VHE γ-ray regime, despite the extensive coverage of the H.E.S.S. Galactic Plane Survey.
The radio source PMN J1708−4419 is located at αJ2000 = 17h08m30s and δJ2000 = −44°19′07″ (Wright et al. 1994). The local maximum in the radio contours at the center of Fig. 1 is largely due to this very bright point source, clearly visible in the 330 MHz VLA radio image (see Fig. A.2). Although its position is compatible with the centroid of the H.E.S.S. source, an association between the two is unlikely given the spectrum of the radio source. Using data from the VLA (at 330 MHz and 1.4 GHz), Molonglo Galactic Plane Survey (MGPS; cataloged as J 170828−441823 at 840 MHz, and Parkes-MIT-NRAO (PMN; cataloged as PMN J1708−4419 at 4.8 GHz), we derive a spectral index α = −0.81 ± 0.08 in the radio domain, consistent with the value α = −0.9 derived by Frail et al. (1994) over a narrower range in frequency, from 330 to 840 MHz. The steep spectral index suggests that PMN J1708−4419 is extragalactic, since Galactic point-like sources are typically compact H ii regions, for which the radio spectral index is positive; therefore, it is unlikely to be associated with the extended emission of H.E.S.S. J1708−443. Upon a deeper inspection of this source using high-resolution unpublished ATCA radio data (Dodson & Golap, personal communication), this bright source can be further resolved into two sources. However, the spectral indices above were calculated on the basis of observing it as a single unresolved source, because this is the way that the low-resolution radio surveys detected them.
In order to quantify the contribution any putative, unresolved point source could make to the flux observed from H.E.S.S. J1708−443, one can compare the symmetric 2D Gaussian curve of a point source to that of the extended H.E.S.S. source. This demonstrates that any single unresolved point source could not account for more than ~ 6% of the total flux from H.E.S.S. J1708−443.
5. Summary
H.E.S.S. observations of the γ-ray pulsar PSR B1706−44 have led to the detection of an extended (σ = 0.29° ± 0.04°) source of VHE γ-ray emission, H.E.S.S. J1708−443, in the Galactic plane. Its energy spectrum is well-described by a power law with a photon index Γ = 2.0 ± 0.1stat ± 0.2sys and a normalization at 1 TeV of φ0 = (4.2 ± 0.8stat ± 1.0sys) × 10-12 cm-2 s-1 TeV-1. The corresponding integral flux F(1–10 TeV) = 3.8 × 10⁻¹² ph cm-2 s-1 is roughly 17% of the Crab Nebula. The possible associations of H.E.S.S. J1708−443 with an offset, relic PWN of PSR B1706−44 and with the partial shell-type SNR candidate G 343.1−2.3 have been discussed using additional radio and H i line emission data. Given the extended nature of the TeV source and the limited statistics, it is unclear if the emission is associated with the PWN, located at the edge of the H.E.S.S. source, or with the SNR, in which the pulsar is thought to be embedded. Based on energetics and a wealth of information at other wavelengths, neither interpretation can be excluded at this time; furthermore, the possibility remains that both sources contribute to the total observed VHE γ-ray emission. High-spatial-resolution CO mapping of this region would improve our understanding of the molecular environment and might help to identify a preferred MWL counterpart to H.E.S.S. J1708−443. Deeper exposure in the TeV regime would also provide vital statistics and enable more detailed morphological and spectral studies.
The Crab Nebula spectrum published in Aharonian et al. (2006a) is adopted as the reference Crab spectrum throughout this paper.
Acknowledgments
The support of the Namibian authorities and of the University of Namibia in facilitating the construction and operation of H.E.S.S. is gratefully acknowledged, as is the support by the German Ministry for Education and Research (BMBF), the Max Planck Society, the French Ministry for Research, the CNRS-IN2P3 and the Astroparticle Interdisciplinary Programme of the CNRS, the UK Science and Technology Facilities Council (STFC), the IPNP of the Charles University, the Polish Ministry of Science and Higher Education, the South African Department of Science and Technology and National Research Foundation, and by the University of Namibia. We appreciate the excellent work of the technical support staff in Berlin, Durham, Hamburg, Heidelberg, Palaiseau, Paris, Saclay, and in Namibia in the construction and operation of the equipment. We would also like to thank R. Dodson and K. Golap for providing part of the radio data used in the analysis.
References
- Abdo, A. A., Ackermann, M., Ajello, M., et al. 2010, ApJS, 188, 405 [NASA ADS] [CrossRef] [Google Scholar]
- Acero, F., Aharonian, F., Akhperjanian, A. G., et al. 2009, Science, 326, 1080 [NASA ADS] [CrossRef] [PubMed] [Google Scholar]
- Aharonian, F. A., Atoyan, A. M., & Kifune, T. 1997, MNRAS, 291, 162 [NASA ADS] [CrossRef] [Google Scholar]
- Aharonian, F., Akhperjanian, A. G., Aye, K.-M., et al. 2005a, A&A, 432, L9 [NASA ADS] [CrossRef] [EDP Sciences] [Google Scholar]
- Aharonian, F., Akhperjanian, A. G., Aye, K.-M., et al. 2005b, Science, 307, 1938 [NASA ADS] [CrossRef] [PubMed] [Google Scholar]
- Aharonian, F., et al. (H.E.S.S. Collaboration) 2005c, A&A, 437, L7 [NASA ADS] [CrossRef] [EDP Sciences] [Google Scholar]
- Aharonian, F. A., Akhperjanian, A. G., Bazer-Bachi, A. R., et al. 2005d, A&A, 442, L25 [NASA ADS] [CrossRef] [EDP Sciences] [Google Scholar]
- Aharonian, F., et al. (H.E.S.S. Collaboration) 2006a, A&A, 457, 899 [NASA ADS] [CrossRef] [EDP Sciences] [Google Scholar]
- Aharonian, F., et al. (H.E.S.S. Collaboration) 2006b, A&A, 448, L43 [NASA ADS] [CrossRef] [EDP Sciences] [Google Scholar]
- Aharonian, F., et al. (H.E.S.S. Collaboration) 2006c, ApJ, 636, 777 [Google Scholar]
- Aharonian, F., et al. (H.E.S.S. Collaboration) 2006d, A&A, 460, 365 [NASA ADS] [CrossRef] [EDP Sciences] [Google Scholar]
- Aharonian, F., et al. (H.E.S.S. Collaboration) 2007a, A&A, 472, 489 [NASA ADS] [CrossRef] [EDP Sciences] [Google Scholar]
- Aharonian, F., et al. (H.E.S.S. Collaboration) 2007b, A&A, 464, 235 [Google Scholar]
- Aharonian, F., et al. (H.E.S.S. Collaboration) 2007c, ApJ, 661, 236 [NASA ADS] [CrossRef] [Google Scholar]
- Aharonian, F., Akhperjanian, A. G., Barres de Almeida, U., et al. 2008, A&A, 477, 353 [Google Scholar]
- Aharonian, F., Akhperjanian, A. G., Anton, G., et al. 2009, A&A, 503, 817 [NASA ADS] [CrossRef] [EDP Sciences] [Google Scholar]
- Amato, E., Guetta, D., & Blasi, P. 2003, A&A, 402, 827 [NASA ADS] [CrossRef] [EDP Sciences] [Google Scholar]
- Becker, W., Brazier, K. T. S., & Truemper, J. 1995, A&A, 298, 528 [NASA ADS] [Google Scholar]
- Bednarek, W., & Bartosik, M. 2003, A&A, 405, 689 [NASA ADS] [CrossRef] [EDP Sciences] [Google Scholar]
- Berge, D., Funk, S., & Hinton, J. 2007, A&A, 466, 1219 [Google Scholar]
- Blondin, J. M., Chevalier, R. A., & Frierson, D. M. 2001, ApJ, 563, 806 [NASA ADS] [CrossRef] [Google Scholar]
- Bock, D. C.-J., & Gvaramadze, V. V. 2002, A&A, 394, 533 [NASA ADS] [CrossRef] [EDP Sciences] [Google Scholar]
- Bolz, O. 2004, Ph.D. in Physics, Ruprecht-Karls-Universität Heidelberg [Google Scholar]
- Chadwick, P. M., Dickinson, M. R., Dipper, N. A., et al. 1998, Astropart. Phys., 9, 131 [NASA ADS] [CrossRef] [Google Scholar]
- Chaves, R. C. G., de Oña Wilhemi, E., & Hoppe, S. H. 2008, in Am. Inst. Phys. Conf. Ser., ed. F. A. Aharonian, W. Hofmann, & F. Rieger, 1085, 219 [Google Scholar]
- Cioffi, D. F., McKee, C. F., & Bertschinger, E. 1988, ApJ, 334, 252 [NASA ADS] [CrossRef] [Google Scholar]
- Cordes, J. M., & Lazio, T. J. W. 2002, unpublished [arXiv:0207156] [Google Scholar]
- de Jager, O. C., & Djannati-Ataï, A. 2008, [arXiv:0803.0116] [Google Scholar]
- Di Salvo, T., Iaria, R., Méndez, M., et al. 2005, ApJ, 623, L121 [NASA ADS] [CrossRef] [Google Scholar]
- Dodson, R., & Golap, K. 2002, MNRAS, 334, L1 [NASA ADS] [CrossRef] [Google Scholar]
- Duncan, A. R., Stewart, R. T., Haynes, R. F., & Jones, K. L. 1995, MNRAS, 277, 36 [NASA ADS] [Google Scholar]
- Enomoto, R., Kushida, J., Nakamori, T., et al. 2009, ApJ, 703, 1725 [NASA ADS] [CrossRef] [Google Scholar]
- Feldman, G. J., & Cousins, R. D. 1998, Phys. Rev. D, 57, 3873 [Google Scholar]
- Fich, M., Blitz, L., & Stark, A. A. 1989, ApJ, 342, 272 [NASA ADS] [CrossRef] [Google Scholar]
- Finley, J. P., Srinivasan, R., Saito, Y., et al. 1998, ApJ, 493, 884 [NASA ADS] [CrossRef] [Google Scholar]
- Forman, W., Jones, C., Cominsky, L., et al. 1978, ApJS, 38, 357 [NASA ADS] [CrossRef] [Google Scholar]
- Frail, D. A., Goss, W. M., & Whiteoak, J. B. Z. 1994, ApJ, 437, 781 [NASA ADS] [CrossRef] [Google Scholar]
- Funk, S., Hermann, G., Hinton, J., et al. 2004, Astropart. Phys., 22, 285 [NASA ADS] [CrossRef] [Google Scholar]
- Gaensler, B. M., Schulz, N. S., Kaspi, V. M., Pivovaroff, M. J., & Becker, W. E. 2003, ApJ, 588, 441 [NASA ADS] [CrossRef] [Google Scholar]
- Gallant, Y. A. 2007, Ap&SS, 309, 197 [NASA ADS] [CrossRef] [Google Scholar]
- Giacani, E. B., Frail, D. A., Goss, W. M., & Vieytes, M. 2001, AJ, 121, 3133 [NASA ADS] [CrossRef] [Google Scholar]
- Gillessen, S., Hinton, J., & H.E.S.S. Collaboration. 2005, in Am. Inst. Phys. Conf. Ser., ed. F. A. Aharonian, H. J. Völk, & D. Horns, High Energy Gamma-Ray Astronomy, 745, 758 [Google Scholar]
- Gotthelf, E. V., Halpern, J. P., & Dodson, R. 2002, ApJ, 567, L125 [NASA ADS] [CrossRef] [Google Scholar]
- Hillas, A. M. 1985, in International Cosmic Ray Conference, ed. F. C. Jones, 3, 445 [Google Scholar]
- Hoppe, S., de Oña-Wilhemi, E., Khélifi, B., et al. 2009, [arXiv:0906.5574] [Google Scholar]
- Horns, D., Aharonian, F., Santangelo, A., Hoffmann, A. I. D., & Masterson, C. 2006, A&A, 451, L51 [NASA ADS] [CrossRef] [EDP Sciences] [Google Scholar]
- Johnston, S., Lyne, A. G., Manchester, R. N., et al. 1992, MNRAS, 255, 401 [NASA ADS] [CrossRef] [Google Scholar]
- Johnston, S., Nicastro, L., & Koribalski, B. 1998, MNRAS, 297, 108 [NASA ADS] [CrossRef] [Google Scholar]
- Kelner, S. R., Aharonian, F. A., & Bugayov, V. V. 2006, Phys. Rev. D, 74, 034018 [NASA ADS] [CrossRef] [Google Scholar]
- Kennel, C. F., & Coroniti, F. V. 1984, ApJ, 283, 694 [NASA ADS] [CrossRef] [Google Scholar]
- Kifune, T., Tanimori, T., Ogio, S., et al. 1995, ApJ, 438, L91 [NASA ADS] [CrossRef] [Google Scholar]
- Koribalski, B., Johnston, S., Weisberg, J. M., & Wilson, W. 1995, ApJ, 441, 756 [NASA ADS] [CrossRef] [Google Scholar]
- Kushida, J., Tanimori, T., Kubo, H., et al. 2003, in International Cosmic Ray Conference, 4, 2493 [Google Scholar]
- Li, T.-P., & Ma, Y.-Q. 1983, ApJ, 272, 317 [NASA ADS] [CrossRef] [Google Scholar]
- Manchester, R. N., & Taylor, J. H. 1977, Pulsars (San Francisco: W. H. Freeman) [Google Scholar]
- McAdam, W. B., Osborne, J. L., & Parkinson, M. L. 1993, Nature, 361, 516 [NASA ADS] [CrossRef] [Google Scholar]
- McClure-Griffiths, N. M., Dickey, J. M., Gaensler, B. M., et al. 2005, ApJS, 158, 178 [NASA ADS] [CrossRef] [Google Scholar]
- Nicastro, L., Johnston, S., & Koribalski, B. 1996, A&A, 306, L49 [Google Scholar]
- Ogio, S., Kifune, T., et al. 1993, in International Cosmic Ray Conference, 1, 392 [Google Scholar]
- Pittori, C., Verrecchia, F., Chen, A. W., et al. 2009, A&A, 506, 1563 [NASA ADS] [CrossRef] [EDP Sciences] [Google Scholar]
- Ptuskin, V. S., & Zirakashvili, V. N. 2005, A&A, 429, 755 [NASA ADS] [CrossRef] [EDP Sciences] [MathSciNet] [PubMed] [Google Scholar]
- Romani, R. W., Ng, C.-Y., Dodson, R., & Brisken, W. 2005, ApJ, 631, 480 [NASA ADS] [CrossRef] [Google Scholar]
- Rowell, G. P., Dazeley, S. A., Edwards, P. G., Patterson, J. R., & Thornton, G. J. 1998, A&A, 332, 194 [NASA ADS] [Google Scholar]
- Swanenburg, B. N., Bennett, K., Bignami, G. F., et al. 1981, ApJ, 243, L69 [NASA ADS] [CrossRef] [Google Scholar]
- Sztajno, M., van Paradijs, J., Lewin, W. H. G., et al. 1985, ApJ, 299, 487 [NASA ADS] [CrossRef] [Google Scholar]
- Tanimori, T., et al. 2005, in International Cosmic Ray Conference, 4, 215 [Google Scholar]
- Taylor, J. H., & Cordes, J. M. 1993, ApJ, 411, 674 [NASA ADS] [CrossRef] [Google Scholar]
- Thompson, D. J., Arzoumanian, Z., Bertsch, D. L., et al. 1992, Nature, 359, 615 [NASA ADS] [CrossRef] [Google Scholar]
- Truelove, J. K., & McKee, C. F. 1999, ApJS, 120, 299 [NASA ADS] [CrossRef] [Google Scholar]
- van der Swaluw, E., Achterberg, A., Gallant, Y. A., & Tóth, G. 2001, A&A, 380, 309 [NASA ADS] [CrossRef] [EDP Sciences] [Google Scholar]
- Wang, N., Manchester, R. N., Pace, R. T., et al. 2000, MNRAS, 317, 843 [NASA ADS] [CrossRef] [Google Scholar]
- Wright, A. E., Griffith, M. R., Burke, B. F., & Ekers, R. D. 1994, ApJS, 91, 111 [NASA ADS] [CrossRef] [Google Scholar]
- Yoshikoshi, T., Mori, M., Edwards, P. G., et al. 2009, ApJ, 702, 631 [NASA ADS] [CrossRef] [Google Scholar]
Appendix A: Comparison with H.E.S.S. 2003 dataset
A.1. Recalculation of upper limits using the 2003 dataset
In its commissioning phase, the H.E.S.S. IACT observed the region around the energetic PSR B1706−44 between April and July 2003 (Aharonian et al. 2005a). No evidence for statistically-significant VHE γ-ray emission was found at the pulsar position nor from a region encompassing the partial shell-type SNR G 343.1−2.3. Upper limits (ULs) to the integral flux were published in Aharonian et al. (2005a). The integral flux now measured by H.E.S.S. (see Sect. 3) is not compatible with those originally-published ULs, a discrepancy which motivated a re-analysis of the 2003 H.E.S.S. dataset for this region, using the current H.E.S.S. software.
Although H.E.S.S. is currently an array of four IACTs, it was operating as a two-telescope array from February to December 2003. The 2003 observations yielded a dataset with a livetime of 14.3 h, an average zenith angle of ~26°, and an energy threshold, estimated from Monte Carlo simulations, of ~350 GeV. For γ-hadron separation, standard cuts were used, which require a minimum of 80 p.e. to be recorded per shower image.
Integral flux ULs were calculated from three a priori defined circular regions: a Standard point-like (θ = 0.14°) region centered at the position of PSR B1706−44, a CANGAROO-like region (θ = 0.22°) also centered at the pulsar position, and a Radio arc region centered at the apparent center of the SNR G 343.1−2.3 (αJ2000 = 17h08m, δJ2000 = −44°16′48″; as defined in Aharonian et al. 2005a), with a radius θ = 0.60° in order to completely enclose the complex radio structure. The CANGAROO region is disregarded for the remainder of this Appendix, because its sole purpose was to compare the H.E.S.S. result with the original CANGAROO-I detection, which has since been rescinded (Yoshikoshi et al. 2009), and focus primarily on the Radio arc region (equivalent to Region B; see Sect. 3), which is very similar to the region from which extended VHE γ-rays are now detected (Region C; see Sect. 3).
Event statistics and background parameters for the analyses of the Radio arc region around PSR B1706−44 and SNR G 343.1−2.3.
Background subtraction was performed using the Ring Background Method (Berge et al. 2007) in both the original and revised analysis. The exact inner and outer ring radii, rinner and router respectively, used in the original analysis were not documented; however, the inner ring radius is typically chosen to be slightly larger than the on-source (ON) region (radius θ = 0.60°) and the normalization factor α = 1/7 (the ratio of the ON to off-source (OFF) area). Therefore, for the re-analysis, the inner ring radius is chosen to be 0.65°, which, given α, leads to router = 1.35°. The number of events in the ON and OFF regions, NON and NOFF, respectively, is found to match those given in Aharonian et al. (2005a) to within 8% (see Table A.1), demonstrating that the ring parameters adopted in the re-analysis are approximately equal to those in the original analysis. No exclusion region was placed on the now known-to-exist source, H.E.S.S. J1708−443, i.e. the source is not excluded from OFF regions. In practice this has a negligible effect, since there is little γ-ray emission from H.E.S.S. J1708−443 beyond rinner = 0.65° from its centroid.
The UL (99% confidence level using Feldman & Cousins 1998) on the integral flux from the Radio arc region (Region B) was originally found to be F(>0.35 TeV) < 5.8 × 10⁻¹² ph cm-2 s-1, equivalent to ~5% Crab, assuming the spectrum is described by a power law with a spectral index Γ = 2.5 (Method A in Aharonian et al. 2005a). An alternative UL, F(>0.50 TeV) < 3.5 × 10⁻¹² ph cm-2 s-1, also equivalent to ~5% Crab, was calculated using a method (Method B, described in detail in Aharonian et al. 2005a) which made no assumptions concerning the source spectrum. These ULs are shown in Fig. A.1, where they are compared to the revised calculation (using Method A) of the integral flux UL, plotted as a function of threshold energy E. The revised UL is clearly higher (less stringent) than the one published in Aharonian et al. (2005a). For example, the integral flux above 0.35 TeV is F(> 0.35 TeV) < 9.7 × 10⁻¹² ph cm-2 s-1, equivalent to 9% Crab and above 0.50 TeV is F(> 0.50 TeV) < 7.6 × 10⁻¹² ph cm-2 s-1, equivalent to 12% Crab, again assuming Γ = 2.5. See Table A.1 for a summary and comparison of the event statistics and other analysis parameters from both analyses.
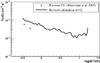 |
Fig. A.1 Integral flux upper limits (ULs) from the Radio arc region encompassing both PSR B1706−44 and SNR G 343.1−2.3. The red points represent the previously-published integral flux ULs from Aharonian et al. (2005a) using the 2003 H.E.S.S. dataset. The black solid line is based on a revised calculation of the UL using the same dataset. |
The use of two-telescope data resulted in a lower sensitivity at the time but would not have had any negative impact on the original determination of ULs from the vicinity of PSR B1706−44. H.E.S.S. currently uses a stereo trigger implemented at the hardware level to select extended air showers (EASs) simultaneously detected by at least two telescopes (Funk et al. 2004). However, from February to July 2003, when the original observations of PSR B1706−44 were carried out, it used an off-line triggering mode, since the central hardware trigger had not yet been installed. In software stereo mode, each recorded EAS receives a time stamp via a GPS (Global Positioning System) clock. The time stamps are then used in the offline data analysis to identify EASs which were observed in coincidence by the two telescopes. The use of a software stereo trigger, while not as efficient as the hardware stereo trigger currently in use, is not expected to have contributed significantly to the discrepancy between the original ULs and the new results.
After investigating various possible reasons for the discrepancy, it remains unknown why the previously-determined ULs were so low, leaving human error or undocumented changes in the analysis software used at the time as possible explanations. It is important to note that many other published results based on data taken during H.E.S.S.’s commissioning phase have been subsequently confirmed by the full four-telescope array with a hardware trigger, e.g. observations of RX J1713−3946 (Aharonian et al. 2007b) and Sgr A∗ (Aharonian et al. 2009).
A.2. Compatibility between detected flux and 2003 upper limits
The upper limits calculated in the previous section cannot be directly compared to the new H.E.S.S. results, based on the 2007 dataset (presented in Sect. 3), because they assume a spectral index Γ = 2.5 and a low energy threshold. The new VHE γ-ray source, H.E.S.S. J1708−443, has a much harder spectral index Γ = 2.0 ± 0.1stat ± 0.2sys. Furthermore, the minimum energy threshold of the H.E.S.S. array has increased due to the reflectivity of the IACT mirrors diminishing from 2003 to 2007, which reduces the array’s ability to detect faint EASs initiated by lower-energy γ-rays.
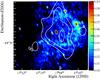 |
Fig. A.2 Image showing the intensity of the radio emission measured by the Very Large Array (VLA) (Frail et al. 1994) at 330 MHz in the vicinity of PSR B1706−44, smoothed with a Gaussian of width σ = 0.03°. The observations have a half-power beamwidth of 0.03° × 0.015°. The radio arc of the partial shell-type SNR G 343.1−2.3 is clearly visible as well as the diffuse emission both inside and outside the arc. The white contours correspond to a smoothed VHE excess of 0.14, 0.17, and 0.21 γ-rays arcmin-2, taken from the image in Fig. 1, left. The horizontal stripes visible at Dec = −44°40′ and Dec = −43°47.5′ are imperfections which resulted from the joining of data to form the final wide-field image (Frail et al. 1994). The bright point source at the center of the radio image is PMN J1708−4419, likely an extragalactic object seen in projection (see Sect. 4.3). |
A re-analysis of the 2003 dataset, using the current H.E.S.S. software and assuming Γ = 2.0, yields a flux upper limit (99% confidence level) F(>0.6 TeV) < 6.3 × 10⁻¹² ph cm-2 s-1, equivalent to ~13% Crab, for Region B. Analysis of the 2007 dataset shows a statistically-significant signal from Region B, F(>0.6 TeV) ≈ 6.5 × 10⁻¹² ph cm-2 s-1, equivalent to ~ 13% Crab. These two flux values are statistically compatible, given the typical uncertainties in the measured flux normalization (±~20%) and spectral index (± ~0.2).
Furthermore, the new analysis results for H.E.S.S. J1708–443 (Region C), based on the 2007 dataset, have been confirmed using an independent data calibration and analysis chain, and the cross-check analysis is also compatible with the presented results.
All Tables
Event statistics and background parameters for the analyses of the Radio arc region around PSR B1706−44 and SNR G 343.1−2.3.
All Figures
|
Fig. 1 Left: image of the VHE γ-ray excess (in units of γ-rays arcmin-2) from H.E.S.S. J1708−443, smoothed with a 2D Gaussian with a width σ = 0.10°. The blue-to-red color transition is chosen to reduce the appearance of features which are not statistically significant. The white cross is located at the best-fit position of the center-of-gravity of the emission and its size represents the statistical error of the fit. The small and large dotted white circles, labeled A and C, respectively, denote the regions used for spectral analysis. The a priori defined Region B, from which the detection significance was calculated, is represented by a dotted green circle. The three regions are summarized in Table 2. The position of the pulsar PSR B1706−44, at the center of region A, is marked by a square. The inset (bottom-left corner) shows the point-spread function of the H.E.S.S. telescope array for this particular dataset, smoothed in the same manner as the excess image. Radio contours of constant intensity, as seen at 330 MHz with the Very Large Array (VLA), are shown in green. The radio data were smoothed with a Gaussian of width σ = 0.03°. The local maximum in the radio contours at the center of the image is largely due to PMN J1708−4419, an extragalactic object seen in projection (see Sect. 4.3). Right: gamma-ray excess in quadratic bins of 0.175° width. The upper number in each bin is the excess summed within this bin, and the lower number is the corresponding statistical error. The blue contours correspond to a smoothed excess of 0.14, 0.17, and 0.21 γ-rays arcmin-2, taken from the image on the left. The red-rimmed bin is centered on the pulsar position. Note the different field-of-view used in the two figures. |
| In the text | |
|
Fig. 2 Differential energy spectrum of H.E.S.S. J1708−443, extracted from Region C (see Table 2). The solid line shows the result of a power-law fit. The error bars denote 1-σ statistical errors. The bottom panel shows the residuals of the power-law fit. Events with energies between 0.6 and 28 TeV were used in the determination of the spectrum, and the minimum significance per bin is 1σ. |
| In the text | |
|
Fig. 3 Large field-of-view (FoV; 5.1° × 5.1°) VHE γ-ray image of the region containing H.E.S.S. J1708−443. The Gaussian-smoothed (σ = 0.10°) VHE γ-ray excess from Fig. 1 (left) is shown in color. The white contours indicate the intensity of the 330 MHz radio emission detected with Very Large Array (VLA) observations (see also the green contours in Fig. 1, left). The dotted white box represents the FoV covered by the VLA observations. Outside of this region, green contours indicate the lower-resolution 2.4 GHz radio continuum data (Duncan et al. 1995) taken with the Parkes telescope; these observations have a half-power beamwidth of ~ 10.4′. This image also shows the approximately ring-shaped region used for normalizing the background in the ON-OFF background method (see Sect. 2.3); this region is delimited by the large dashed white circles, excluding the known TeV source H.E.S.S. J1702−420 located toward the Northwest. The Galactic plane is also located toward the NW and is indicated by a thick black dotted line. |
| In the text | |
|
Fig. 4 Left: the grey-scale image shows the intensity of H i line emission in units of K km s-1, measured by the Parkes radio telescope during the Southern Galactic Plane Survey (SGPS) (McClure-Griffiths et al. 2005). The intensities are integrated in the velocity range −13.79 km s-1 to −21.21 km s-1 (shown as a shaded region in the velocity profile, right), corresponding to a near/far kinematic distance of 1.6–2.3 kpc/13.0–13.7 kpc. Contours of the Gaussian-smoothed (σ = 0.10°) VHE γ-ray excess are shown in blue. The red contours depict the intensity of the radio emission measured by the Very Large Array (VLA) at 330 MHz (see also Fig. 1 left). The radio data have been smoothed with σ = 0.03°. The white circle illustrates the integration region for the velocity profile shown on the right. Right: velocity profile of H i line emission intensity, integrated over the region enclosed by the dashed circle on the left. The velocity resolution is 0.08 km s-1. The kinematic distance, shown in red, is derived from the velocity using the Galactic rotation curve of Fich et al. (1989). |
| In the text | |
|
Fig. A.1 Integral flux upper limits (ULs) from the Radio arc region encompassing both PSR B1706−44 and SNR G 343.1−2.3. The red points represent the previously-published integral flux ULs from Aharonian et al. (2005a) using the 2003 H.E.S.S. dataset. The black solid line is based on a revised calculation of the UL using the same dataset. |
| In the text | |
|
Fig. A.2 Image showing the intensity of the radio emission measured by the Very Large Array (VLA) (Frail et al. 1994) at 330 MHz in the vicinity of PSR B1706−44, smoothed with a Gaussian of width σ = 0.03°. The observations have a half-power beamwidth of 0.03° × 0.015°. The radio arc of the partial shell-type SNR G 343.1−2.3 is clearly visible as well as the diffuse emission both inside and outside the arc. The white contours correspond to a smoothed VHE excess of 0.14, 0.17, and 0.21 γ-rays arcmin-2, taken from the image in Fig. 1, left. The horizontal stripes visible at Dec = −44°40′ and Dec = −43°47.5′ are imperfections which resulted from the joining of data to form the final wide-field image (Frail et al. 1994). The bright point source at the center of the radio image is PMN J1708−4419, likely an extragalactic object seen in projection (see Sect. 4.3). |
| In the text | |
Current usage metrics show cumulative count of Article Views (full-text article views including HTML views, PDF and ePub downloads, according to the available data) and Abstracts Views on Vision4Press platform.
Data correspond to usage on the plateform after 2015. The current usage metrics is available 48-96 hours after online publication and is updated daily on week days.
Initial download of the metrics may take a while.