Fig. 4
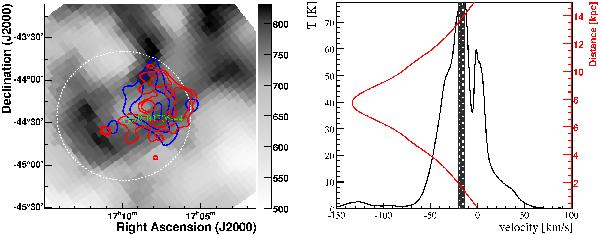
Left: the grey-scale image shows the intensity of H i line emission in units of K km s-1, measured by the Parkes radio telescope during the Southern Galactic Plane Survey (SGPS) (McClure-Griffiths et al. 2005). The intensities are integrated in the velocity range −13.79 km s-1 to −21.21 km s-1 (shown as a shaded region in the velocity profile, right), corresponding to a near/far kinematic distance of 1.6–2.3 kpc/13.0–13.7 kpc. Contours of the Gaussian-smoothed (σ = 0.10°) VHE γ-ray excess are shown in blue. The red contours depict the intensity of the radio emission measured by the Very Large Array (VLA) at 330 MHz (see also Fig. 1 left). The radio data have been smoothed with σ = 0.03°. The white circle illustrates the integration region for the velocity profile shown on the right. Right: velocity profile of H i line emission intensity, integrated over the region enclosed by the dashed circle on the left. The velocity resolution is 0.08 km s-1. The kinematic distance, shown in red, is derived from the velocity using the Galactic rotation curve of Fich et al. (1989).
Current usage metrics show cumulative count of Article Views (full-text article views including HTML views, PDF and ePub downloads, according to the available data) and Abstracts Views on Vision4Press platform.
Data correspond to usage on the plateform after 2015. The current usage metrics is available 48-96 hours after online publication and is updated daily on week days.
Initial download of the metrics may take a while.