Fig. 4
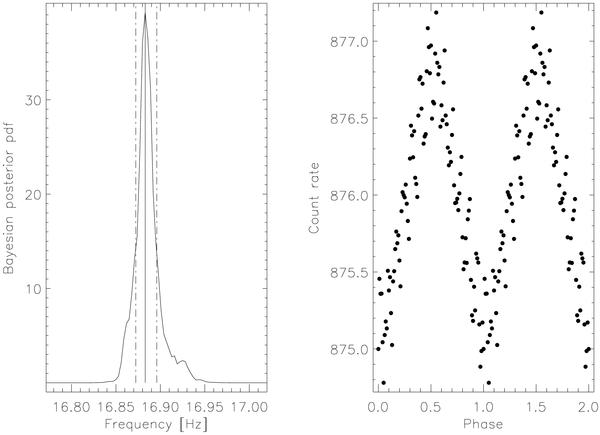
Bayesian posterior probability density vs. frequencies in the time interval of 259–267 s from the giant flare onset. Dashed vertical lines indicate the 68% region of the highest probability density. Odds ratio of periodic vs. constant model is ~200. The right panel depicts the phase-folded light curve with frequency fQPO = 16.88 Hz, with an almost perfect sinusoidal shape (for details, see text).
Current usage metrics show cumulative count of Article Views (full-text article views including HTML views, PDF and ePub downloads, according to the available data) and Abstracts Views on Vision4Press platform.
Data correspond to usage on the plateform after 2015. The current usage metrics is available 48-96 hours after online publication and is updated daily on week days.
Initial download of the metrics may take a while.