Fig. 3
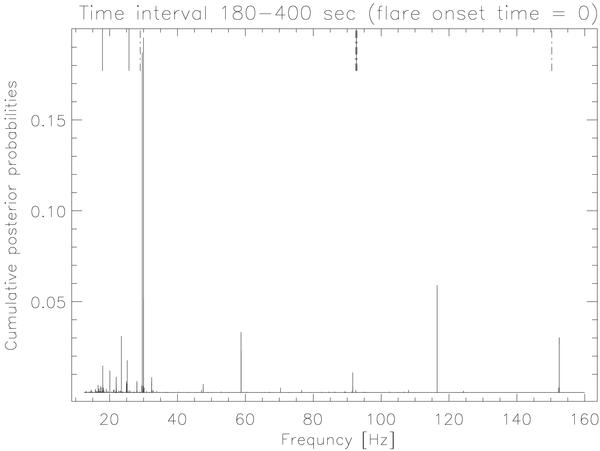
The Bayesian posterior probability density vs. trial frequency of the periodic signal for the giant flare data set of SGR 1806−20. QPO frequencies already detected by averaged power spectrum analysis and also with other mission RHESSI (Israel et al. 2005; Watts & Strohmayer 2006) are marked as small lines at the top axis. Those QPO frequencies are also detected by us. In addition, we have detected several more QPO frequencies (21, 59, and 116 Hz) with the Bayesian method, which were also predicted by Colaiuda et al. (2009).
Current usage metrics show cumulative count of Article Views (full-text article views including HTML views, PDF and ePub downloads, according to the available data) and Abstracts Views on Vision4Press platform.
Data correspond to usage on the plateform after 2015. The current usage metrics is available 48-96 hours after online publication and is updated daily on week days.
Initial download of the metrics may take a while.