Fig. 1
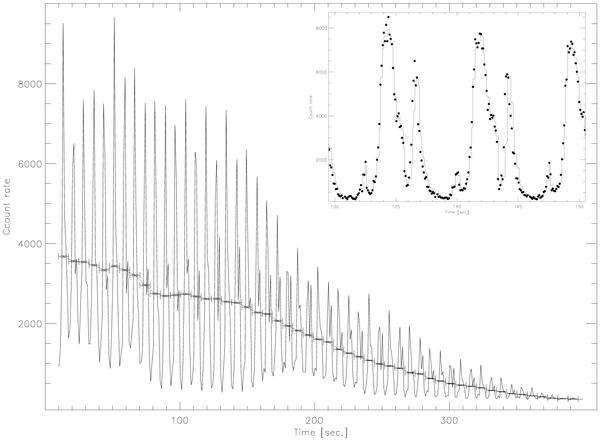
Light curve of the RXTE giant flare of SGR 1806−20 observed on 2004 Dec. 27. The general decay of the giant flare with a bumpy structure on top of it, namely a strongly periodic signal due to rotation (7.56 s). The inset panel shows the rotational modulated light curve (filled circles), together with fitted piecewise constant model (solid line, Hutter 2007), shown here only for 2.5 rotational cycles, with a very complex light curve structure (see text for details).
Current usage metrics show cumulative count of Article Views (full-text article views including HTML views, PDF and ePub downloads, according to the available data) and Abstracts Views on Vision4Press platform.
Data correspond to usage on the plateform after 2015. The current usage metrics is available 48-96 hours after online publication and is updated daily on week days.
Initial download of the metrics may take a while.