Free Access
Fig. 12
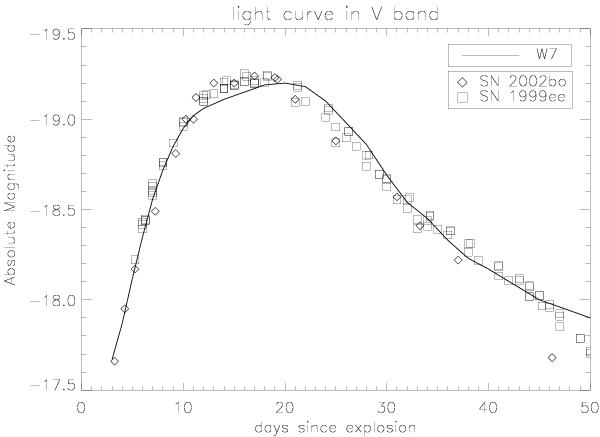
LTE model light curve of the W7 explosion model in the V band compared to two observed SN Ia light curves of SN 1999ee and SN 2002bo.
Current usage metrics show cumulative count of Article Views (full-text article views including HTML views, PDF and ePub downloads, according to the available data) and Abstracts Views on Vision4Press platform.
Data correspond to usage on the plateform after 2015. The current usage metrics is available 48-96 hours after online publication and is updated daily on week days.
Initial download of the metrics may take a while.