Fig. 6
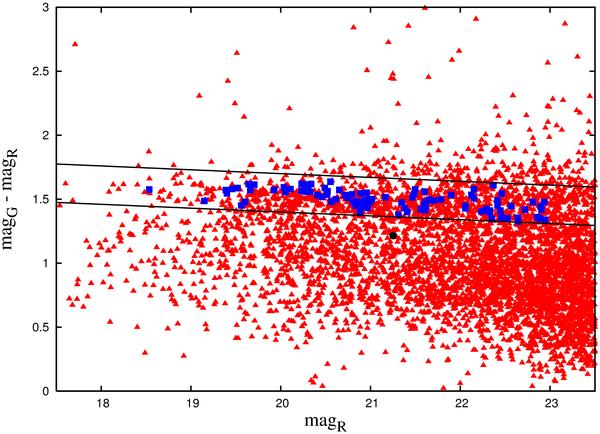
Colour–magnitude diagram of Abell 611. The black lines define the cluster red-sequence, while the blue filled squares indicate the red sequence galaxies lying within 100 arcsec from the BCG centre, which were included in the lens modelling. The black circle indicates the galaxy located between the lensed images B.1 and C.1 (see Fig. 5), which was included in the lens modelling for its position; the magnitude estimate derived for this galaxy from the LBT data is contaminated by the flux contribution of the nearby lensed feature (see text for details).
Current usage metrics show cumulative count of Article Views (full-text article views including HTML views, PDF and ePub downloads, according to the available data) and Abstracts Views on Vision4Press platform.
Data correspond to usage on the plateform after 2015. The current usage metrics is available 48-96 hours after online publication and is updated daily on week days.
Initial download of the metrics may take a while.