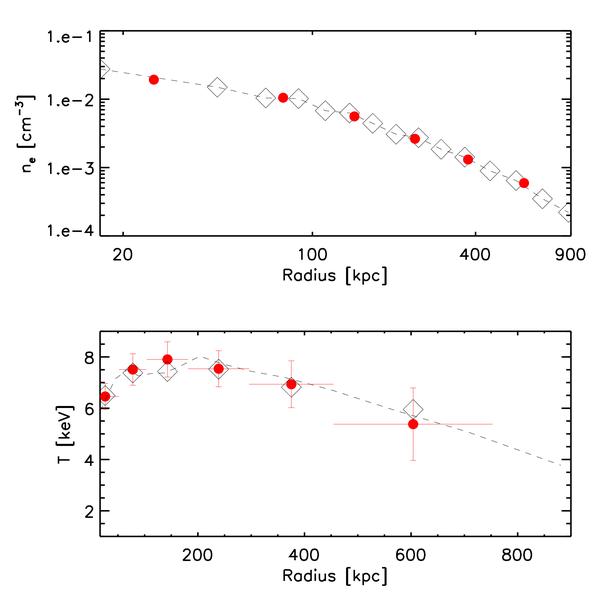
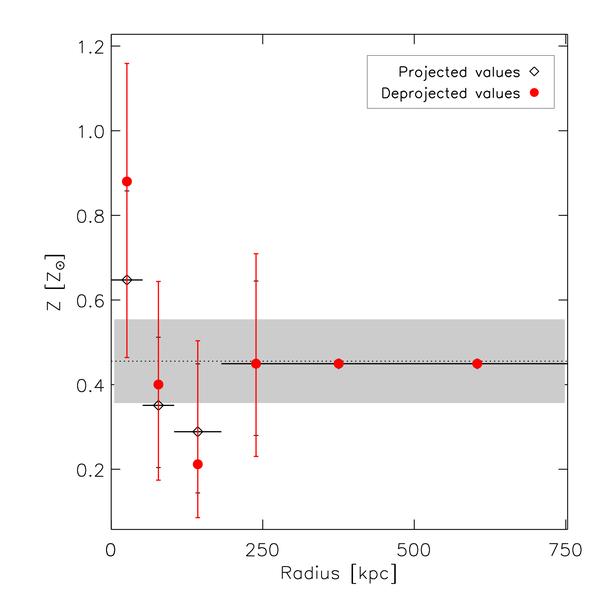
Fig. 2
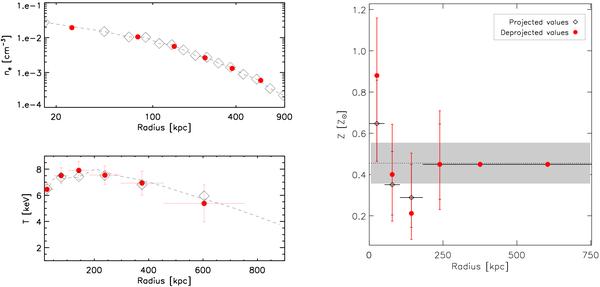
(Top left panel) Deprojected gas density profile. The red circles indicate the values determined by the normalisation of the thermal spectra, while diamonds represent the values obtained combining both spectral and surface brightness measurements: the dashed line shows the best-fit profile. (Bottom left panel) ICM temperature profile. The figure shows the projected temperature values, directly inferred from the spectral analysis (red filled circles) and the deprojected values, which were rebinned to the same binning of the spectral profile (diamonds). The dashed line shows the deprojected best-fit profile. (Right panel) The projected (black empty diamonds) and deprojected (red filled circles) metallicity profile for Abell 611 inferred from the X-ray analysis. The dotted line represents the mean metallicity value Z = (0.45 ± 0.1) Z⊙, as determined through the fit of the spectrum extracted in the area with radius R = 2.9 arcmin, i.e. the cluster area covered by our spectral analysis. The grey region indicates the 1σ confidence level.
Current usage metrics show cumulative count of Article Views (full-text article views including HTML views, PDF and ePub downloads, according to the available data) and Abstracts Views on Vision4Press platform.
Data correspond to usage on the plateform after 2015. The current usage metrics is available 48-96 hours after online publication and is updated daily on week days.
Initial download of the metrics may take a while.