Fig. 4
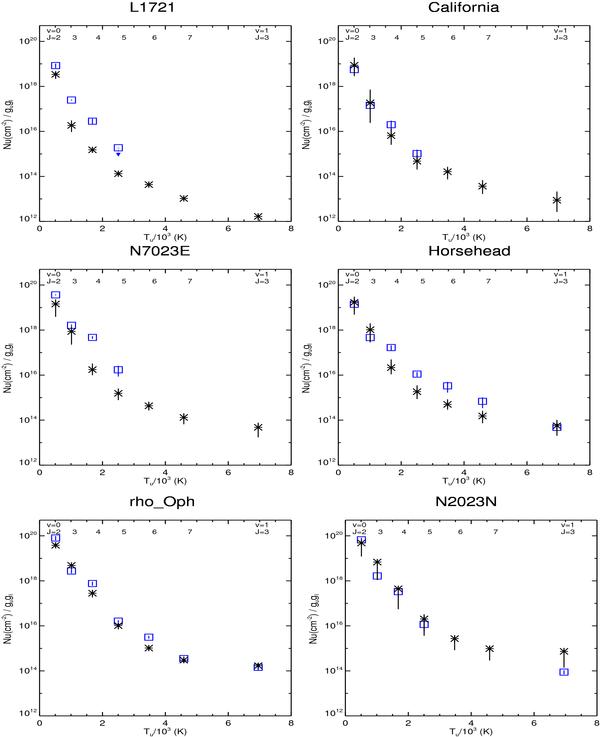
Excitation diagram of H2. Nu is the column density of the transition upper level, gu is the degeneracy of the upper level and Tu is the upper level energy in Kelvin. The squares show the data. The H2 ortho-to-para ratio is taken equal to 3. The error bars are small in size compared to the symbol size. The arrows indicate upper limits. The stars show the PDR model predictions. For each object, H2 line intensities were computed from linear interpolation of our grid of models with the suitable values of the FUV incident radiation field and gas density (see Table 1). We use χ = 4.5 and n = 103 cm-3 for L1721; χ = 19 and n = 5 × 103 cm-3 for the California; χ = 51 and n = 104 cm-3 for N7023E; χ = 60 and n = 104 cm-3 for the Horsehead; χ = 250 and n = 104 cm-3 for rho Oph; χ = 550 and n = 5 × 104 cm-3 for N2023N. Error bars due to uncertainties in the UV field are given. For comparison of the predicted and observed line intensities, in the model the PDRs have been tilted with respect to the line of sight with cos(θ) = 0.15.
Current usage metrics show cumulative count of Article Views (full-text article views including HTML views, PDF and ePub downloads, according to the available data) and Abstracts Views on Vision4Press platform.
Data correspond to usage on the plateform after 2015. The current usage metrics is available 48-96 hours after online publication and is updated daily on week days.
Initial download of the metrics may take a while.