| Issue |
A&A
Volume 527, March 2011
|
|
|---|---|---|
| Article Number | A75 | |
| Number of page(s) | 3 | |
| Section | Stellar structure and evolution | |
| DOI | https://doi.org/10.1051/0004-6361/201015950 | |
| Published online | 28 January 2011 | |
Research Note
Strong linear polarization of V4332 Sagittarii: a dusty disc geometry⋆
Department for Astrophysics,
N. Copernicus Astronomical Center, Rabiańska
8,
87-100
Toruń,
Poland
e-mail: This email address is being protected from spambots. You need JavaScript enabled to view it.
; This email address is being protected from spambots. You need JavaScript enabled to view it.
Received:
19
October
2010
Accepted:
25
November
2010
Abstract
Context. The eruption of V4332 Sgr was observed in 1994. During the outburst, the object became extremely red, so it is considered as belonging to luminous red transients of the V838 Mon type. It has recently been suggested that the central object in V4332 Sgr is now hidden in a dusty disc and that the photospheric spectrum of this object observed in the optical results from scattering the central star radiation on dust grains in the disc.
Aims. One expects significant polarization of the spectrum in this case. We investigate this prediction.
Methods. We present and analyse polarimetric observations of V4332 Sgr in the V and R photometric bands done with the NOT telescope.
Results. The optical light of V4332 Sgr is linearly polarized with a degree of ~26% in the V band and ~11% in R.
Conclusions. Discussion of the observed polarization leads us to conclude that the photospheric spectrum observed in V4332 Sgr is probably produced by dust scattering not only in the disc but also in the outflow from the object seen in the emission features.
Key words: polarization / scattering / stars: individual: V4332 Sagittarii / stars: peculiar / stars: late-type / circumstellar matter
Based on observations made with the Nordic Optical Telescope, operated on the island of La Palma jointly by Denmark, Finland, Iceland, Norway, and Sweden, in the Spanish Observatorio del Roque de los Muchachos of the Instituto de Astrofisica de Canarias.
Currently at: Max-Planck Institut für Radioastronomie, Auf dem Hügel 69, 53121 Bonn, Germany.
© ESO, 2011
1. Introduction
The eruption of V4332 Sgr was observed in 1994 (Martini et al. 1999). Discovered as a possible nova, the object appeared to be unusual, mainly because of its spectral evolution. It quickly evolved from K to M spectral types and after a month it declined as very late M-type giant. The object is now classified as a red optical transient of the V838 Mon type (Munari et al. 2002; Tylenda et al. 2005). As discussed by Tylenda & Soker (2006), thermonuclear mechanisms (classical nova, He-shell flash) probably cannot explain the observed outbursts of these objects. The stellar collision-merger scenario proposed in Soker & Tylenda (2003) and further developed in Tylenda & Soker (2006) is a promising hypothesis for explaining the nature of these eruptions.
Now more than a decade after outburst, V4332 Sgr continues to present unusual observational characteristics. Apart from displaying an M-type continuum in the optical, it shows a unique emission line spectrum of very low excitation (Tylenda et al. 2005; Kimeswenger 2006). The object is also very bright in the infrared (Tylenda et al. 2005; Banerjee et al. 2007).
In a recent paper, after having analysed the optical emission line spectrum and the spectral energy distribution of V4332 Sgr, Kamiński et al. (2010) conclude that the main object, probably an M-type giant, is hidden in a circumstellar disc seen almost edge-on. The stellar-like spectrum observed in the optical probably results from scattering the central star light on dust grains at the outer edge of the disc. This implies that the optical spectrum should display a significant polarization. In the present paper we report on polarimetric measurements done in the V and R photometric bands, which show that the optical light from V4332 Sgr is indeed strongly polarized.
2. Observations and data processing
Polarimetric observations of V4332 Sgr were obtained on August 8, 2010 at the 2.56 m Nordic
Optical Telescope using the Andalucia Faint Object Spectrograph and Camera (ALFOSC).
Polarimetry was performed in the Johnson V and Kron-Cousins
R bands by inserting a half-wave plate and a calcite plate in the light
beam. A calcite plate splits the incident light beam into two beams of orthogonal
polarization, i.e. ordinary (o) and extraordinary (e) beams. For ALFOSC, this provides two
overlapping images of the field of view separated by 15 arcsec. For each filter, a sequence
of 8 exposures was obtained with the half-wave plate rotated by
 between 0° and
  .
The exposure times per image were 400 s in the V band and 70 s in
R.
.
The exposure times per image were 400 s in the V band and 70 s in
R.
Data were reduced using IRAF1. All the CCD frames were corrected for bias, flat-field, and cosmic-ray effects. The object’s signal was measured for the ordinary (fo) and extraordinary (fe) beam on each image. The signal was integrated within circular apertures (of the same size for each exposure), and sky background was subtracted.
For each retarder angle, θi, the normalized
flux difference was calculated, 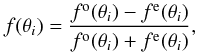 (1)from which reduced
(normalized) Stokes parameters PQ and
PU were derived (see Fossati et al. 2007)
(1)from which reduced
(normalized) Stokes parameters PQ and
PU were derived (see Fossati et al. 2007)  The
reduced parameters are in the following relation to the standard IQU Stokes
parameters
The
reduced parameters are in the following relation to the standard IQU Stokes
parameters 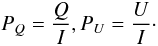 (6)For the 8-angle
sequence of retarder positions, two values for each of the reduced Stokes parameters are
obtained. For each filter we took average values of
PQ and
PU to derive the degree of linear
polarization, PL, and the position angle PA of the
maximum-polarization vector (see Landi Degl’Innocenti et al.
2007)
(6)For the 8-angle
sequence of retarder positions, two values for each of the reduced Stokes parameters are
obtained. For each filter we took average values of
PQ and
PU to derive the degree of linear
polarization, PL, and the position angle PA of the
maximum-polarization vector (see Landi Degl’Innocenti et al.
2007) 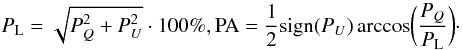 (7)Uncertainties were first
estimated as standard deviations of the background counts propagated in the calculation of
PL and PA (see Fossati et al.
2007). Those errors, however, turned out to be insignificant when compared to
errors related to the deviations between the two sets of the derived Stokes parameters
PQ and
PU. Below we provide those deviations (in
the sense of 1σ) propagated to the calculation of
PL and PA as our final uncertainties.
(7)Uncertainties were first
estimated as standard deviations of the background counts propagated in the calculation of
PL and PA (see Fossati et al.
2007). Those errors, however, turned out to be insignificant when compared to
errors related to the deviations between the two sets of the derived Stokes parameters
PQ and
PU. Below we provide those deviations (in
the sense of 1σ) propagated to the calculation of
PL and PA as our final uncertainties.
The instrumental polarization was checked by observations of a high polarization standard, BD+64 106, and a low polarization standard, BD+32 3739. For the latter star we found PL(V) = (0.08 ± 0.07)% and PL(R) = (0.04 ± 0.09)% (for the V and R bands, respectively)2, which is consistent with the catalogue polarization of this object (Turnshek et al. 1990). For the high-polarization standard we found PL(V) = (5.50 ± 0.18)% and PL(R) = (5.30 ± 0.01)%, which can be compared with the catalogue values of PL(V) = (5.69 ± 0.04)% and PL(R) = (5.15 ± 0.10)% (Schmidt et al. 1992). We also measured polarization of a few field stars in the frames, and they all showed no or a marginal polarization within measurement uncertainties. We can therefore conclude that there is no significant instrument polarization that could affect the derived values of PL.
The estimated position angles for the high-polarization standard are
 and
and  ,
which can be compared to the catalogue values of
,
which can be compared to the catalogue values of  and
and  (Schmidt et al. 1992). The differences between the
derived and standard values can be interpreted as due to instrumental polarization. We treat
the differences ZP = PA0 − PA as zero-points for the scale of
PA, i.e.
(Schmidt et al. 1992). The differences between the
derived and standard values can be interpreted as due to instrumental polarization. We treat
the differences ZP = PA0 − PA as zero-points for the scale of
PA, i.e.  and
and  .
.
3. Results
V4332 Sgr is at present very faint in the optical (V ≈ 19.8 mag,
R ≈ 17.9 mag). Nevertheless we have found that the polarization of V4332
Sgr is significant in both bands. We obtained
PL(V) = (25.8 ± 3.0)% and
PL(R) = (11.3 ± 2.0)%. The derived position
angles are  and
and  ,
which gives
,
which gives  and PA
 when corrected for the instrument polarization (see above). (Here errors also include
contributions from the uncertainties of the derived PA zero points.) A weighted mean of the
two angles gives
when corrected for the instrument polarization (see above). (Here errors also include
contributions from the uncertainties of the derived PA zero points.) A weighted mean of the
two angles gives  .
.
4. Discussion
Our polarimetric observations were performed in the spectral regions, where, apart from the stellar (photospheric) spectrum, emission features significantly contribute to the photometric fluxes, as can be seen from Fig. 1. We estimated that the atomic and molecular emission lines constitute ~40% of the total fluxes in both bands. As discussed in Kamiński et al. (2010), the emission features are produced in the radiation pumping mechanism most probably in a matter directly visible by the observer. Therefore no polarization in the lines is expected. If this is the case, the polarization degree of the continuum would be ~40% and ~20% in the V and R bands, respectively. In either case, spectropolarimetric observations would be of particular importance for a more conclusive discussion of the origin of the polarization and the nature of V4332 Sgr.
 |
Fig. 1 The thick lines (green and red) are transmission curves of the V and R filters used in the polarimetric observations. Spectra of V4332 Sgr are shown for comparison. The part for λ < 5400 Å is a low-resolution spectrum obtained in October 2005 in SAAO (unpublished). The spectrum covering the remaining wavelength range was obtained with the Subaru Telescope in June 2009 and is described in Kamiński et al. (2010). Spectra are normalized to the peaks of the Na i doublet at 5890 Å. |
Regardless of whether the polarization is limited to the continuum or not, the observed degree of polarization of V4332 Sgr is very high. This limits the choice of polarization mechanisms. It is difficult to explain that high polarization with dichroic extinction caused by aligned non-spherical grains. There is no known alignment mechanism, which could give the required high alignment efficiency (e.g. Bastien & Menard 1990). The only alternative is the light scattering in circumstellar material. This is consistent with the work of Kamiński et al. (2010), where the authors postulate that the central M-type giant in V4332 Sgr is hidden in a dusty disc seen almost edge-on. The stellar-like spectrum observed in the optical would in fact be the giant spectrum scattered on dust grains in the disc. In this case, forward scattering on big dust grains at the outer edge of the disc is most effective in producing the observed radiation. However, the expected polarization degree is small, if scattering occurs at small angels. Radiative transfer modelling of scattering in a disc seen at inclination angles 80° ≤ i ≤ 90° done in Bastien & Menard (1990) predicts a maximum polarization degree of 8–11%. Gomez’s Hamburger (IRAS 18059-3211) is a good example of a high-inclination disc scattering light from the central star (Wood et al. 2008). This object shows a maximum polarization of 20–30% in outer faint regions of the observed image (Ruiz et al. 1987), i.e., regions produced by scattering at large angles. In the central, bright regions, produced by forward scattering, the observed polarization is much lower. If the image of Gomez’s Hamburger were not resolved, as for V4332 Sgr, the net polarization would have been observed at ~10% or less.
Kamiński et al. (2010) also postulate that there is an outflowing matter in V4332 Sgr, where the observed emission features of atoms and molecules are formed by absorption and re-emission of the radiation from the central object. This matter is cold, as indicated by the profiles of the emission molecular bands analysed in Kamiński et al. (2010), and most probably contains dust. Thus the observed optical continuum can also be partly produced in the outflow scattering the central star radiation. If the outflow is concentrated along the disc axis, scattering would occur at angles close to 90°, leading to a considerable polarization of the observed spectrum. Bastien & Menard (1990) (see also Solc 1989) found that for bipolar outflows from discs with inclination angles of 80–90° the maximum polarization can reach 60–94%. Therefore the high polarization of the observed spectrum of V4332 Sgr may indicate that this spectrum is produced by dust scattering not only in the disc but also in the matter outflowing along the disc axis.
In either case, the present polarization measurements confirm the conclusion of Kamiński et al. (2010) that the main object in V4332 Sgr is now hidden in a dusty disc seen almost edge-on. This implies that the image of the object should display a dark lane across the image, as it observed e.g. in Gomez’s Humburger. In November 1997 an image of V4332 Sgr was taken by HST (briefly discussed in Kimeswenger 2006). No dark lane is seen but the image profile is not significantly different from that of the point source. With the lower limit distance of 1 kpc, as derived in Kamiński et al. (2010), the angular resolution of HST of 0.1 arcsec implies that the linear dimensions of the V4332 Sgr disc are ≲100 AU. We do not know the nature of the disc, nor when it was formed. If it resulted from the 1994 eruption, e.g. as a remnant of a binary merger, its dimensions are expected to be much smaller that the above upper limit.
IRAF is distributed by the National Optical Astronomy Observatories, which are operated by the Association of Universities for Research in Astronomy, Inc., under cooperative agreement with the National Science Foundation.
After correcting these results for bias, which is related to PL being a positive definite quantity, and following instructions in Simmons & Stewart (1985), we got corresponding 1σ confidence ranges of PL(V) = 0.0 ÷ 0.13% and PL(R) = 0.0 ÷ 0.07%.
Acknowledgments
The data presented here have been taken using ALFOSC, which is owned by the Instituto de Astrofisica de Andalucia (IAA) and operated at the Nordic Optical Telescope under agreement between IAA and the NBIfAFG of the Astronomical Observatory of Copenhagen. The research reported on in this paper has partly been supported by a grant No. N N203 403939 financed by the Polish Ministry of Sciences and Higher Education.
References
- Banerjee, D. P. K., Misselt, K. A., Su, K. Y. L., Ashok, N. M., & Smith, P. S. 2007, ApJ, 666, L25 [NASA ADS] [CrossRef] [Google Scholar]
- Bastien, P., & Menard, F. 1990, ApJ, 364, 232 [NASA ADS] [CrossRef] [Google Scholar]
- Fossati, L., Bagnulo, S., Mason, E., & Landi Degl’Innocenti, E. 2007, The Future of Photometric, Spectrophotometric and Polarimetric Standardization, ASP Conf. Ser., 364, 503 [NASA ADS] [Google Scholar]
- Kamiński, T., Schmidt, M., & Tylenda, R. 2010, A&A, 522, A75 [NASA ADS] [CrossRef] [EDP Sciences] [Google Scholar]
- Kimeswenger, S. 2006, Astron. Nachr., 327, 44 [NASA ADS] [CrossRef] [Google Scholar]
- Martini, P., Wagner, R. M., Tomaney, A., et al. 1999, AJ, 118, 1034 [NASA ADS] [CrossRef] [Google Scholar]
- Munari, U., Henden, A., Kiyota, S., et al. 2002, A&A, 389, L51 [NASA ADS] [CrossRef] [EDP Sciences] [Google Scholar]
- Landi Degl’Innocenti, E., Bagnulo, S., & Fossati, L. 2007, The Future of Photometric, Spectrophotometric and Polarimetric Standardization, ASP Conf. Ser., 364, 495 [NASA ADS] [Google Scholar]
- Ruiz, M. T., Blanco, V., Maza, J., et al. 1987, ApJ, 316, L21 [NASA ADS] [CrossRef] [Google Scholar]
- Schmidt, G. D., Elston, R., & Lupie, O. L. 1992, AJ, 104, 1563 [NASA ADS] [CrossRef] [Google Scholar]
- Simmons, J. F. L., & Stewart, B. G. 1985, A&A, 142, 100 [NASA ADS] [Google Scholar]
- Soker, N., & Tylenda, R. 2003, ApJ, 582, L105 [NASA ADS] [CrossRef] [Google Scholar]
- Solc, M. 1989, Astron. Nachr., 310, 329 [NASA ADS] [CrossRef] [Google Scholar]
- Turnshek, D. A., Bohlin, R. C., Williamson, R. L., II, et al. 1990, AJ, 99, 1243 [NASA ADS] [CrossRef] [Google Scholar]
- Tylenda, R., & Soker, N. 2006, A&A, 451, 223 [NASA ADS] [CrossRef] [EDP Sciences] [Google Scholar]
- Tylenda, R., Crause, L. A., Górny, S. K., & Schmidt, M. R. 2005, A&A, 439, 651 [NASA ADS] [CrossRef] [EDP Sciences] [Google Scholar]
- Whittet, D. C. B. 2003, Dust in the galactic environment (Bristol: IoP) [Google Scholar]
- Wood, K., Whitney, B. A., Robitaille, T., & Draine, B. T. 2008, ApJ, 688, 1118 [NASA ADS] [CrossRef] [Google Scholar]
All Figures
|
Fig. 1 The thick lines (green and red) are transmission curves of the V and R filters used in the polarimetric observations. Spectra of V4332 Sgr are shown for comparison. The part for λ < 5400 Å is a low-resolution spectrum obtained in October 2005 in SAAO (unpublished). The spectrum covering the remaining wavelength range was obtained with the Subaru Telescope in June 2009 and is described in Kamiński et al. (2010). Spectra are normalized to the peaks of the Na i doublet at 5890 Å. |
| In the text | |
Current usage metrics show cumulative count of Article Views (full-text article views including HTML views, PDF and ePub downloads, according to the available data) and Abstracts Views on Vision4Press platform.
Data correspond to usage on the plateform after 2015. The current usage metrics is available 48-96 hours after online publication and is updated daily on week days.
Initial download of the metrics may take a while.