| Issue |
A&A
Volume 527, March 2011
|
|
|---|---|---|
| Article Number | A131 | |
| Number of page(s) | 7 | |
| Section | Stellar structure and evolution | |
| DOI | https://doi.org/10.1051/0004-6361/201015798 | |
| Published online | 10 February 2011 | |
The XMM-Newton survey of the Small Magellanic Cloud: discovery of the 11.866 s Be/X-ray binary pulsar XMMU J004814.0-732204(SXP11.87)
1
Max-Planck-Institut für extraterrestrische Physik,
Giessenbachstraße,
85748
Garching,
Germany
e-mail: This email address is being protected from spambots. You need JavaScript enabled to view it.
2
School of Physics and Astronomy, University of Southampton,
Highfield,
Southampton
SO17 1BJ,
UK
3
South African Astronomical Observatory, PO Box 9, Observatory 7935, Cape Town,
South Africa
4
University of Maryland, Baltimore County, Mail Code 662, NASA Goddard Space Flight
Center, Greenbelt,
MD
20771,
USA
5
XMM-Newton Science Operations Centre, ESAC, ESA, PO Box 78, 28691
Villanueva de la Cañada, Madrid, Spain
6 University of Western Sydney, Locked Bag 1797, Penrith South
DC, NSW1797, Australia
7
Department of Astrophysics, Astronomy and Mechanics, Faculty of
Physics, University of Athens, Panepistimiopolis, 15784 Zografos, Athens, Greece
8
Foundation for Research and Technology Hellas,
IESL,
Greece
9
INAF, Istituto di Astrofisica Spaziale e Fisica Cosmica Milano,
via E. Bassini 15, 20133
Milano,
Italy
10
Warsaw University Observatory, Aleje Ujazdowskie 4, 00-478
Warsaw,
Poland
Received: 21 September 2010
Accepted: 6 November 2010
Abstract
Aims. One of the goals of the XMM-Newton survey of the Small Magellanic Cloud is to study the Be/X-ray binary population. During one of our first survey observations, a bright new transient − XMMU J004814.0-732204 − was discovered.
Methods. We present the analysis of the EPIC X-ray data, together with optical observations, to investigate the spectral and temporal characteristics of XMMU J004814.0-732204.
Results. We found coherent X-ray pulsations in the EPIC data with a period of (11.86642 ± 0.00017) s. The X-ray spectrum can be modelled by an absorbed power law with an indication for a soft excess. Depending on the modelling of the soft X-ray spectrum, the photon index ranges between 0.53 and 0.66. We identify the optical counterpart as a B = 14.9 mag star that was monitored during the MACHO and OGLE-III projects. The optical light curves show regular outbursts by ~0.5 mag in B and R and up to 0.9 mag in I, which repeat on a time scale of about 1000 days. The OGLE-III optical colours of the star are consistent with an early B spectral type. An optical spectrum obtained at the 1.9 m telescope of the South African Astronomical Observatory in December 2009 shows Hα emission with an equivalent width of 3.5 ± 0.6 Å.
Conclusions. The X-ray spectrum and the detection of pulsations suggest that XMMU J004814.0-732204is a new high-mass X-ray binary pulsar in the SMC. The long term variability and the Hα emission line in the spectrum of the optical counterpart identify it as a Be/X-ray binary system.
Key words: galaxies: individual: Small Magellanic Cloud / galaxies: stellar content / stars: emission-line, Be / stars: neutron / X-rays: binaries
© ESO, 2011
1. Introduction
The Small Magellanic Cloud (SMC) hosts an extraordinary high number of about 80 known Be/X-ray binary systems, compared to the ~70 known in the Galaxy (as of 2006, Liu et al. 2006), which is a factor of ~100 more massive than the SMC. Be/X-ray binaries are a subclass of high-mass X-ray binaries containing an early type Be donor star with equatorial mass ejection and an accreting neutron star (NS). Owing to the non-spherical and time-variable mass ejection, these systems show up as X-ray transients, when the NS crosses the disk during the periastron passage, leading to enhanced matter accretion for a few days (type I outbursts). Longer outbursts lasting several weeks (type II) are thought to be caused by expansion of the circumstellar disk (see e.g. Okazaki & Negueruela 2001).
One of the aims of the XMM-Newton (Jansen et al. 2001) large-programme SMC survey (Haberl & Pietsch 2008a) is ongoing study of the Be/X-ray binary population of the SMC, which can be used as a star formation tracer for ~50 (30–70) Myr old populations (Antoniou et al. 2010). In this paper we present the analysis of X-ray and optical data from the newly discovered X-ray pulsar XMMU J004814.0-732204.
2. Observations and data reduction
The new transient was discovered on 2009 Oct. 03, during observation 13 (observation ID 0601211301) of the XMM-Newton large-programme SMC survey. The source was located near the border of CCD 1 (partly spread onto CCD 4) of the EPIC-pn instrument (Strüder et al. 2001) and on CCD 2 of EPIC-MOS2 (Turner et al. 2001). There are no MOS1 data for this source because it was located on CCD 6, which has been switched off since XMM-Newton revolution 961. The soft proton background was at a very low level during the whole observation. Therefore, no background screening was necessary, resulting in net exposure times of 30 779 s and 32 368 s for EPIC-pn and EPIC-MOS2, respectively.
We used XMM-Newton SAS 10.0.01 to process the data. We identified sources in the field of view (FoV) for astrometric bore-sight correction by comparison with the Magellanic Clouds Photometric Survey of Zaritsky et al. (2002), obtaining a shift of ΔRA = − 0.15″ and ΔDec = − 1.23″. The corrected position of the transient as found by emldetect is RA = 00h48m14 07 and Dec = –73°22′04
 4 (J2000.0), with a statistical error of 0.06″ and a systematic uncertainty of ~1″ (1σ confidence for both cases).
For the extraction of EPIC spectra, we selected single-pixel events from the EPIC-pn data (PATTERN = 0) and single to quadruple events with PATTERN ≤ 12 from EPIC-MOS2 data, both with FLAG = 0. The SAS task eregionanalyse was used to determine circular source extraction regions by optimizing the signal-to-noise ratio as shown in Fig. 1. We ensured that the source extraction region has a distance of > 10″ to other detected sources. For the background extraction region, we chose a circle in an area free of point sources and on the same CCD as the source for both instruments. The EPIC-pn and EPIC-MOS2 spectra contain 9286 and 8054 background-subtracted counts, respectively, and were binned to a minimum signal-to-noise ratio of 5 for each bin. For the timing analysis, we also used double-pixel events for EPIC-pn. To increase the statistics for the timing analysis we also generated a merged event list from both instruments, containing 25 945 cts (source + background).
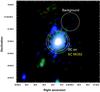 |
Fig. 1 EPIC colour image of XMMU J004814.0-732204combining pn and MOS data. The red, green, and blue colours represent the X-ray intensities in the 0.2−1.0, 1.0−2.0, and 2.0−4.5 keV energy bands. Circles indicate the extraction regions (with radii of 49″ and 57″ for pn and MOS2 source regions and 45″ for the background). |
Spectral fit results.
3. X-ray data analysis and results
3.1. Spectral analysis of the X-ray data
We used XSPEC (Arnaud 1996) version 12.5.0x for spectral fitting. The two EPIC spectra were fitted simultaneously with a common set of spectral model parameters and only a relative normalisation factor was allowed to vary to account for instrumental differences. The spectrum (Fig. 2) was modelled first with an absorbed power law. We fixed the Galactic photo-electric absorption at a column density of NH,GAL = 6 × 1020 cm-2 with abundances according to Wilms et al. (2000), whereas the SMC column density was a free parameter with abundances for elements heavier than helium fixed at 0.2. The best-fit parameters are summarised in Table 1 where errors denote 90% confidence ranges.
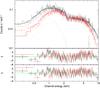 |
Fig. 2 EPIC spectra of XMMU J004814.0-732204. The top panel shows the EPIC-pn (black) and EPIC-MOS2 (red) spectra, together with the best-fit model (solid line) of an absorbed power law (dashed line) plus black-body (dotted line) and iron fluorescent line (dash-dotted line). The residuals (re-binned for better comparison by an additional factor of three) are plotted for this model (bottom panel) and for the best-fit single power law model (middle panel). |
The extraction for the EPIC-pn spectrum is hampered by the CCD gap cutting the extraction region. The missing area is taken into account in calculating effective area by arfgen. However, we noticed that when using the default spatial resolution (parameter badpixelresolution = 2.0″) the flux derived from the EPIC-pn spectrum is higher by (21 ± 3)% compared to MOS. Using badpixelresolution = 1.0″ reduces the flux discrepancy to 7%, which is within the expected systematic uncertainties in the presence of gaps. Extracting the EPIC-pn spectrum from a smaller source region with radius 6″, so that the complete source region is placed on CCD 1, yields a flux that only differs by ~1% from the MOS2 value. The spectral shape is not affected by the CCD gap, but the number of source counts for the smaller extraction region is a factor of two lower.
In principle, this fit is formally acceptable and additional components are not required. However, soft excesses and fluorescent emission from iron are known to contribute to the X-ray emission of some Be/X-ray binaries (e.g. Eger & Haberl 2008; La Palombara et al. 2009; Hickox et al. 2004). To investigate these possibilities we first added a black-body emission component to the model (Table 1). This component contributes ~2% to the observed flux and ~3% to the absorption-corrected luminosity. For the bolometric luminosity we obtained (1.40 ± 0.35) × 1035 erg s-1. Compared to the single power law the reduced χ2 improved from 1.09 to 1.01, which corresponds to an F-test chance probability of 2.6 × 10⁻¹⁰ and formally proves the significance of this component (but see Protassov et al. 2002,for limitations of the F-test). An additional emission line with fixed energy at 6.4 keV and unresolved line width (fixed at 0) yielded a line flux of 4.6 ± 4.0 × 10⁻⁶ photons cm-2 s-1 corresponding to the equivalent width given in Table 1. Substituting the 6.4 keV line by a 6.7 keV line for ionised Fe XXV resulted in an upper limit for the equivalent width of 41 eV.
If we replace the black-body component by a multi-temperature disk black-body model (diskbb in XSPEC), we derive a lower limit for the inner disk radius of  km (for a disk inclination of Θ = 0 with
  ). Following Hickox et al. (2004) to estimate the inner disk radius, we infer
  km.
km.
3.2. Timing analysis of the X-ray data
We corrected the event’s arrival times to the solar system barycentre using the SAS task barycen and searched for periodicities in the X-ray light curves using fast Fourier transform (FFT) and light curve folding techniques. The power density spectra derived from light curves in various energy bands from both EPIC instruments showed a periodic signal at 0.084 Hz. To increase the signal-to-noise ratio, we then created light curves from the merged event list of EPIC-pn and EPIC-MOS2 (delimited to common time intervals). Figure 3 shows the inferred power density spectrum from the 0.2–10.0 keV energy band with the clear peak at a frequency of 0.084 Hz. Following Haberl et al. (2008) we used a Bayesian periodic signal detection method (Gregory & Loredo 1996) to determine the pulse period with 1σ error to (11.86642 ± 0.00017) s. The pulse profiles folded with this period in the EPIC standard energy bands (0.2–0.5 keV, 0.5–1.0 keV, 1.0–2.0 keV, 2.0–4.5 keV, and 4.5–10 keV) are plotted in Fig. 4 along with hardness ratios derived from the pulse profiles in two adjacent energy bands (HRi = (Ri + 1 − Ri)/(Ri + 1 + Ri) with Ri denoting the background-subtracted count rate in energy band i (with i from 1 to 4)). Assuming a sinusoidal pulse profile, we determined a pulsed fraction of (7.5 ± 1.0)% for the 0.2 − 10.0 keV band. The profiles suggest some evolution from a single-peaked to a double-peaked structure with increasing energy, causing the variations in hardness ratios HR3 and HR4. A strong dependence of the pulse profiles on energy (e.g. Wilson et al. 2003; Haberl et al. 2008) and luminosity (e.g. Bildsten et al. 1997) is seen from a number of high-mass X-ray binaries.
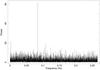 |
Fig. 3 Power density spectrum created from the merged EPIC-pn and EPIC-MOS2 data in the 0.2–10.0 keV energy band. The time binning of the input light curve is 1.882 s. |
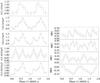 |
Fig. 4 Left: pulse profiles obtained from the merged EPIC data in different energy bands (for better statistics the first two standard energy bands were combined in the top panel, the bottom panel shows all five energy bands combined). The profiles are background-subtracted and normalised to the average count rate (0.116, 0.228, 0.249, 0.207, and 0.801 cts s-1, from top to bottom. Right: hardness ratios as a function of pulse phase derived from the pulse profiles in two neighbouring standard energy bands. |
3.3. Long-term X-ray variability
The position of XMMU J004814.0-732204was covered in two previous XMM-Newton observations on 2000 October 15 (ObsID: 0110000101) and 2007 April 11 (ObsID: 0404680301) with a background-screened net exposure of 21.6 ks and 17.6 ks, respectively. In the later observation, the source position was only covered by the MOS2 FoV. In both observations, no source was detected above a likelihood threshold of 6. Using sensitivity maps we derived 3σ upper limits of 2.5 × 10⁻³ cts s-1 and 2.7 × 10⁻³ cts s-1, respectively. Assuming the same spectrum as during the outburst, this corresponds to a flux limit of 1.7 × 10⁻¹⁴ erg cm-2 s-1 (from October 2000, measured by EPIC-pn) and 6.1 × 10⁻¹⁴ erg cm-2 s-1 (April 2007, EPIC-MOS2) in the 0.2 − 10.0 keV band and to luminosity limits of 7.6 × 1033 erg s-1 and 2.7 × 1034 erg s-1, respectively.
Also in a Chandra (Weisskopf et al. 2000) ACIS-I observation (Observation ID 2945) on 2002 October 2 this position was covered with a 11.8 ks exposure, and no source was detected. We used the CIAO (Version 4.2) task aprates to estimate a 3σ upper limit of 5.1 × 10⁻⁴ cts s-1. Assuming the same spectrum as above, this corresponds to a flux limit of 1.6 × 10⁻¹⁴ erg cm-2 s-1 in the 0.2−10.0 keV band (luminosity of 7.1 × 1033 erg s-1).
The upper limits from the XMM-Newton and Chandra observations show that XMMU J004814.0-732204increased in brightness at least by a factor of 560 during its outburst.
RXTE monitoring of the SMC has been carried out for nearly a decade (Galache et al. 2008) and XMMU J004814.0-732204has frequently fallen within the pointing direction of the telescope, often at a collimator response of ≥ 60%. Unfortunately, the time of the XMM-Newton detection on MJD 55107 falls into the gap in the RXTE monitoring (MJD 55 080–55 138) when the spacecraft was temporarily disabled, so there is no simultaneous RXTE coverage. Within the envelope of the last 9.5 years there are no possible detections of this source in the periods of time (approximately 6.5 years) when the source was above a 0.6 collimator response. The RXTE pulse monitoring is sensitive to detections with a pulsed amplitude in excess of 0.15–0.2 cts/s/PCU. This approximately translates into ~0.5–1.0 cts/s/PCU – depending on the collimator response and pulsed fraction (which is not very high for XMMU J004814.0-732204) – or a luminosity limit of ~2 × 1036 erg s-1 for a source in the SMC.
4. Optical data
4.1. Identification of the optical counterpart
Searching optical catalogues of Zaritsky et al. (2002), MACHO and OGLE, we found three stars that are located within the 3σ error radius around the XMM-Newton position. Their positions and magnitudes from Zaritsky et al. (2002), and their OGLE-II and MACHO entries are listed in Table 2. A finding chart produced from OGLE-III data is shown in Fig. 5.
The star closest to the X-ray position (OGLE-III 14642) has colours and brightness consistent with an early B star. Its position on the U − B vs. B − V diagram of Be stars (e.g. Fig. 1 of Feinstein & Marraco 1979) is also entirely consistent with it being a Be star. The same holds for the reddening-free Q-index of –0.85 (Johnson & Morgan 1955; Massey et al. 2007). This candidate also appears as number 10287 in the survey list of Massey (2002). The (B − V) colour index from that catalogue is (B − V) = −0.12 ± 0.01. Correcting for an extinction to the SMC of E(B − V) = 0.09 (Schwering & Israel 1991, also used for our spectral type estimates hereafter) gives an intrinsic colour of (B − V) = − 0.21 ± 0.01. From Wegner (1994) this indicates a spectral type in the range B1.5V–B2.5V – typical of optical counterparts to Be/X-ray binaries in the SMC (McBride et al. 2008). However, care must always be taken when interpreting colour information as a spectral type in systems that clearly have circumstellar disks contributing some signal to the B- and V-bands.
Possible optical counterparts of XMMU J004814.0-732204.
Optical photometry was performed at the Faulkes Telescope South (FTS) on 2009 November 25 (MJD 55 160). The telescope is located at Siding Spring, Australia and is a 2 m, fully autonomous, robotic Ritchey-Chrètien reflector on an alt-azimuth mount. The telescope employs a robotic control system (RCS). The telescope was used in real time interface mode for the observation of XMMU J004814.0-732204. All the observations were pipeline-processed (flat-fielding and de-biasing of the images). The I-band magnitude of the optical counterpart was determined to be 15.30 ± 0.02 mag by comparison with several other nearby stars on the same image frame and in the OGLE database. These comparison stars have not exhibited any significant variability in the last eight years of OGLE monitoring.
Figure 6 shows optical and IR photometry of OGLE-III 14642 taken at the different epochs (see Table 3 for the actual values). The earliest optical data come from Massey (2002) and were recorded on 1999 January 8. These data are combined with IR measurements taken on 2002 August 31 with the Sirius camera on the 1.5 m IRSF telescope in South Africa (Kato et al. 2007). Also included is the OGLE I-band measurement taken simultaneously with the Sirius IR data set. These early data are compared to a B,V,R, & I photometric data set recorded on 2009 November 25 from the FTS.
For comparison, a stellar atmosphere model (Kurucz 1979) representing a B2V star (Teff = 22 000 K and log (g) = 4.0) is also shown where the model has been normalised to the most recent B-band measurement. It is very clear that the recent data taken around the time of the XMM-Newton detection represent the source in a much lower activity state than the earlier data. Furthermore, the shape of the model atmosphere indicates clear evidence of a significant IR excess in the past, almost certainly arising from the circumstellar disk of the system. But in late 2009 the disk had diminished significantly, to the extent where there is little in the way of IR excess. This is supported by the very weak Hα emission (see Sect. 4.3 below).
The star OGLE-III 14688 is probably a red (K to M) giant according to its OGLE colours. The light curve shows small variations of the order of 0.1 mag in the I-band, but no evidence of any coherent fluctuations. There is an object from the Two Micron All Sky Survey (Skrutskie et al. 2006) − 2MASS J00481347-7322030 − which is closest to the position of this star, with J = 14.76, H = 14.13, K = 14.04, J − H = 0.63 and H − K = 0.09, which rather points towards a K2 star.
The third object (OGLE-III 14689) is likely a late B-type star (B5–B9) from the OGLE colours. The light curve shows fluctuations of the order of 0.05 mag in the I-band and evidence of a strong modulation at a period of 2.19 days. The folded light curve appears sinusoidal, which is probably evidence of non-radial pulsations in the star (Diago et al. 2008).
The position, optical magnitudes, and colours make the star closest to the X-ray position (OGLE-III 14642) the most likely counterpart.
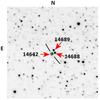 |
Fig. 5 Finding chart of SXP11.87. The I-band image from OGLE-II shows the 3 close objects near the X-ray position marked with their OGLE-III identification (arrows). The two lines further mark the likely counter part. The image size is 1 |


4.2. Long-term variability of OGLE-III 14642
The identification of XMMU J004814.0-732204with OGLE-III 14642 is supported by the MACHO and OGLE light curves. This star shows strong outbursts repeating on time scales of ~1000 days. Figure 7 shows the light curves of the proposed optical counterpart in approximate B and R magnitudes derived from MACHO data (ID 212.15846.31) and in the I-band from OGLE-II and OGLE-III. The I-band data point which we obtained at FTS was added to the OGLE light curve. The MACHO light curve shows two outbursts around April 1995 and January 1998, while OGLE observed six consecutive outbursts between June 1997 and December 2008.
The X-ray flux of the source is not obviously correlated with the optical outburst activity. The first XMM-Newton non-detection was during maximum optical brightness. The Chandra non-detection was close to the maximum optical brightness, the last XMM-Newton non-detection later in the optical decline, while the detection could have happened at the decline or already in optical low-state (see Fig. 7).
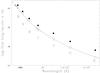 |
Fig. 6 Combined optical-IR flux for our counterpart OGLE-III 14642 at two epochs. a) a historical data set (1999-2002) – solid symbols; b) data set from the time of outburst (Nov.-Dec. 2009) – open symbols. See text for details of the observations. Both data sets are compared to a Kurucz model atmosphere for a B2V star in which this stellar model has been normalised to the outburst B-band point. |
Optical and IR photometry of OGLE-III 14642.
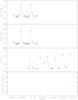 |
Fig. 7 Multi-wavelength light curves of the XMMU J004814.0-732204/OGLE-III 14642 system. The upper two panels show the MACHO B- and R-bands. In the third panel, the OGLE-III I-band light curve is plotted, with the last data point indicating our own measurement using the Faulkes telescope (see text). Dashed lines indicate the times of X-ray measurements, as shown in the bottom panel. Arrows mark upper limits (XMM-Newton , Chandra, and XMM-Newton in chronological order, see Sect. 3.3), the cross indicates the XMM-Newton detection. |
4.3. Optical spectrum
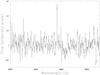 |
Fig. 8 Hα spectrum of the OGLE optical candidate #14642 taken 2009 December 11 at SAAO. |
Spectroscopic observations of the Hα region were made on 11 Dec. 2009 (MJD 55 176) using the 1.9 m telescope of the South African Astronomical Observatory (SAAO). A 1200 lines per mm reflection grating blazed at 6800 Å was used with the SITe CCD, which is effectively 266 × 1798 pixels in size, creating a wavelength coverage of 6200 Å to 6900 Å. The pixel scale in this mode was 0.42 Å/pixel. The data were reduced using IRAF standard routines and the resulting spectrum is shown in Fig. 8. The peak is at 6566 Å, which is consistent with the corresponding rest wavelength of the Hα line corrected for the motion of the SMC. In this mode the spectral resolution is ~0.2 nm for the signal-to-noise of ~10. We measured an Hα line emission width of EW = 3.5 ± 0.6 Å, the error being calculated using the prescription given in Howarth & Phillips (1986).
5. Discussion and conclusions
One of the first XMM-Newton observations of the SMC survey revealed the new high-mass X-ray binary pulsar XMMU J004814.0-732204with a pulse period of 11.866 s (following Coe et al. 2005,we give it the alternative name SXP11.87). Its X-ray behaviour and the properties of the optical counterpart (star with OGLE-III ID 14688) are typical of a Be – neutron star binary system. In particular its appearance as an X-ray transient (a factor of at least 560 brighter during the outburst on October 2009 as compared to non-detections from archival XMM-Newton and Chandra observations), the hard power law shape of the X-ray spectrum, the pulse period, the optical brightness, variability and colours (indicating an early B star), and finally the Hα emission line in the optical spectrum clearly confirm XMMU J004814.0-732204as another Be/X-ray binary in the SMC.
The power law photon index derived from the EPIC spectra of 0.53 − 0.66 (depending on the spectral modelling of the soft part of the spectrum by including an additional soft model component or not) is on the hard side of the distribution of photon indices for Be/X-ray binaries in the SMC, which shows a maximum at ~0.9−1.0 (Haberl et al. 2008; Haberl & Pietsch 2004). The range of values obtained for XMMU J004814.0-732204is similar to the index of 0.35−0.54 reported for the 6.85 s pulsar XTE J0103−728 (also using XMM-Newton data in the same energy band; Haberl & Pietsch 2008b). It should be noted, that the later, also called SXP6.85, was detected at energies up to 35 keV with RXTE and INTEGRAL during a long type II outburst (Townsend et al. 2010) showing that the hard spectrum extends to energies beyond the sensitivity of XMM-Newton . SXP11.87 and SXP6.85 also show similarities in their spectra at energies below 2 keV, indicating a soft X-ray excess. However, the energy resolution of the CCD instruments is not sufficient to determine the exact nature of this component. Some constraints can be inferred by using different models for the soft component. If one assumes a black-body component, a temperature of ~280 eV and a black-body radius of ~13.4 km is derived for SXP11.87. While this could still be compatible with the size of the neutron star, the corresponding black-body radius for SXP6.85 is too large (30 km, Haberl & Pietsch 2008b). Therefore, these authors conclude that the soft excess more likely originates near the inner edge of an accretion disk as expected for intermediate X-ray luminosities. The very similar parameters derived for a soft excess emission suggest the same picture for SXP11.87, although the inferred black-body or inner disk radii seem to be smaller than the corresponding values for SXP6.85. However, emission by diffuse gas through collisional heating or photoionisation is also possible for both cases (Hickox et al. 2004).
The MACHO and OGLE light curves of the optical counterpart of XMMU J004814.0-732204show prominent outbursts repeating on a time scale of about 1000 days. Very similar behaviour was reported from the optical counterpart of the 18.37 s Be/X-ray binary pulsar XMMU J004911.4-724939 which showed two outbursts separated by about 1300 days in MACHO and OGLE-I data (Haberl et al. 2008). Such outburst behaviour is also observed from other (single) Be stars (Mennickent et al. 2002). Because of this and the fact that the outbursts do not repeat strictly periodically, it is unlikely that they are related to the orbital period of the binary system. Moreover, from the Corbet relation between neutron star spin period and the orbital period (Corbet 1984), a much shorter orbital period of about 20 − 200 days is expected (see Laycock et al. 2005; Corbet et al. 2009, for more recent versions of the Ps/Porb diagram).
Science Analysis Software (SAS), http://xmm.esac.esa.int/sas/
Acknowledgments
The XMM-Newton project is supported by the Bundesministerium für Wirtschaft und Technologie/Deutsches Zentrum für Luft- und Raumfahrt (BMWI/DLR, FKZ 50 OX 0001) and the Max-Planck Society. R.S. acknowledges support from the BMWI/DLR grant FKZ 50 OR 0907. S.M., N.L., and A.T. acknowledge the support of ASI through contract I/088/06/0. L.J.T. is in receipt of a University of Southampton Mayflower Scholarship. A.U. acknowledges support from the MNiSW/BST grant.
References
- Antoniou, V., Zezas, A., Hatzidimitriou, D., & Kalogera, V. 2010, ApJ, 716, L140 [NASA ADS] [CrossRef] [Google Scholar]
- Arnaud, K. A. 1996, in Astronomical Data Analysis Software and Systems V, ed. G. H. Jacoby, & J. Barnes, ASP Conf. Ser., 101, 17 [Google Scholar]
- Bildsten, L., Chakrabarty, D., Chiu, J., et al. 1997, ApJS, 113, 367 [NASA ADS] [CrossRef] [Google Scholar]
- Coe, M. J., Edge, W. R. T., Galache, J. L., & McBride, V. A. 2005, MNRAS, 356, 502 [NASA ADS] [CrossRef] [Google Scholar]
- Corbet, R. H. D. 1984, A&A, 141, 91 [NASA ADS] [Google Scholar]
- Corbet, R. H. D., Coe, M. J., McGowan, K. E., et al. 2009, in IAU Symp. 256, ed. J. T. van Loon, & J. M. Oliveira, 361 [Google Scholar]
- Diago, P. D., Gutiérrez-Soto, J., Fabregat, J., & Martayan, C. 2008, A&A, 480, 179 [NASA ADS] [CrossRef] [EDP Sciences] [Google Scholar]
- Eger, P., & Haberl, F. 2008, A&A, 491, 841 [NASA ADS] [CrossRef] [EDP Sciences] [Google Scholar]
- Feinstein, A., & Marraco, H. G. 1979, AJ, 84, 1713 [NASA ADS] [CrossRef] [Google Scholar]
- Galache, J. L., Corbet, R. H. D., Coe, M. J., et al. 2008, ApJS, 177, 189 [NASA ADS] [CrossRef] [Google Scholar]
- Gregory, P. C., & Loredo, T. J. 1996, ApJ, 473, 1059 [NASA ADS] [CrossRef] [Google Scholar]
- Haberl, F., & Pietsch, W. 2004, A&A, 414, 667 [NASA ADS] [CrossRef] [EDP Sciences] [Google Scholar]
- Haberl, F., & Pietsch, W. 2008a, in X-rays From Nearby Galaxies, ed. S. Carpano, M. Ehle, & W. Pietsch, 32 [Google Scholar]
- Haberl, F., & Pietsch, W. 2008b, A&A, 484, 451 [NASA ADS] [CrossRef] [EDP Sciences] [Google Scholar]
- Haberl, F., Eger, P., & Pietsch, W. 2008, A&A, 489, 327 [NASA ADS] [CrossRef] [EDP Sciences] [Google Scholar]
- Hickox, R. C., Narayan, R., & Kallman, T. R. 2004, ApJ, 614, 881 [NASA ADS] [CrossRef] [Google Scholar]
- Hilditch, R. W., Howarth, I. D., & Harries, T. J. 2005, MNRAS, 357, 304 [NASA ADS] [CrossRef] [Google Scholar]
- Howarth, I. D., & Phillips, A. P. 1986, MNRAS, 222, 809 [NASA ADS] [Google Scholar]
- Jansen, F., Lumb, D., Altieri, B., et al. 2001, A&A, 365, L1 [NASA ADS] [CrossRef] [EDP Sciences] [Google Scholar]
- Johnson, H. L., & Morgan, W. W. 1955, ApJ, 122, 142 [NASA ADS] [CrossRef] [Google Scholar]
- Kato, D., Nagashima, C., Nagayama, T., et al. 2007, PASJ, 59, 615 [NASA ADS] [Google Scholar]
- Kurucz, R. L. 1979, ApJS, 40, 1 [NASA ADS] [CrossRef] [Google Scholar]
- La Palombara, N., Sidoli, L., Esposito, P., Tiengo, A., & Mereghetti, S. 2009, A&A, 505, 947 [NASA ADS] [CrossRef] [EDP Sciences] [Google Scholar]
- Laycock, S., Corbet, R. H. D., Coe, M. J., et al. 2005, ApJS, 161, 96 [NASA ADS] [CrossRef] [Google Scholar]
- Liu, Q. Z., van Paradijs, J., & van den Heuvel, E. P. J. 2006, A&A, 455, 1165 [NASA ADS] [CrossRef] [EDP Sciences] [Google Scholar]
- Massey, P. 2002, ApJS, 141, 81 [NASA ADS] [CrossRef] [MathSciNet] [Google Scholar]
- Massey, P., McNeill, R. T., Olsen, K. A. G., et al. 2007, AJ, 134, 2474 [NASA ADS] [CrossRef] [Google Scholar]
- McBride, V. A., Coe, M. J., Negueruela, I., Schurch, M. P. E., & McGowan, K. E. 2008, MNRAS, 388, 1198 [NASA ADS] [CrossRef] [Google Scholar]
- Mennickent, R. E., Pietrzyński, G., Gieren, W., & Szewczyk, O. 2002, A&A, 393, 887 [NASA ADS] [CrossRef] [EDP Sciences] [Google Scholar]
- Okazaki, A. T., & Negueruela, I. 2001, A&A, 377, 161 [NASA ADS] [CrossRef] [EDP Sciences] [Google Scholar]
- Protassov, R., van Dyk, D. A., Connors, A., Kashyap, V. L., & Siemiginowska, A. 2002, ApJ, 571, 545 [NASA ADS] [CrossRef] [Google Scholar]
- Schwering, P. B. W., & Israel, F. P. 1991, A&A, 246, 231 [NASA ADS] [Google Scholar]
- Skrutskie, M. F., Cutri, R. M., Stiening, R., et al. 2006, AJ, 131, 1163 [NASA ADS] [CrossRef] [Google Scholar]
- Strüder, L., Briel, U., Dennerl, K., et al. 2001, A&A, 365, L18 [NASA ADS] [CrossRef] [EDP Sciences] [Google Scholar]
- Townsend, L. J., Coe, M. J., McBride, V. A., et al. 2010, MNRAS, 403, 1239 [NASA ADS] [CrossRef] [Google Scholar]
- Turner, M. J. L., Abbey, A., Arnaud, M., et al. 2001, A&A, 365, L27 [NASA ADS] [CrossRef] [EDP Sciences] [Google Scholar]
- Wegner, W. 1994, MNRAS, 270, 229 [NASA ADS] [CrossRef] [Google Scholar]
- Weisskopf, M. C., Tananbaum, H. D., Van Speybroeck, L. P., & O’Dell, S. L. 2000, in SPIE Conf. Ser. 4012, ed. J. E. Truemper, & B. Aschenbach, 2 [Google Scholar]
- Wilms, J., Allen, A., & McCray, R. 2000, ApJ, 542, 914 [NASA ADS] [CrossRef] [Google Scholar]
- Wilson, C. A., Finger, M. H., Coe, M. J., & Negueruela, I. 2003, ApJ, 584, 996 [NASA ADS] [CrossRef] [Google Scholar]
- Zaritsky, D., Harris, J., Thompson, I. B., Grebel, E. K., & Massey, P. 2002, AJ, 123, 855 [NASA ADS] [CrossRef] [Google Scholar]
All Tables
All Figures
|
Fig. 1 EPIC colour image of XMMU J004814.0-732204combining pn and MOS data. The red, green, and blue colours represent the X-ray intensities in the 0.2−1.0, 1.0−2.0, and 2.0−4.5 keV energy bands. Circles indicate the extraction regions (with radii of 49″ and 57″ for pn and MOS2 source regions and 45″ for the background). |
| In the text | |
|
Fig. 2 EPIC spectra of XMMU J004814.0-732204. The top panel shows the EPIC-pn (black) and EPIC-MOS2 (red) spectra, together with the best-fit model (solid line) of an absorbed power law (dashed line) plus black-body (dotted line) and iron fluorescent line (dash-dotted line). The residuals (re-binned for better comparison by an additional factor of three) are plotted for this model (bottom panel) and for the best-fit single power law model (middle panel). |
| In the text | |
|
Fig. 3 Power density spectrum created from the merged EPIC-pn and EPIC-MOS2 data in the 0.2–10.0 keV energy band. The time binning of the input light curve is 1.882 s. |
| In the text | |
|
Fig. 4 Left: pulse profiles obtained from the merged EPIC data in different energy bands (for better statistics the first two standard energy bands were combined in the top panel, the bottom panel shows all five energy bands combined). The profiles are background-subtracted and normalised to the average count rate (0.116, 0.228, 0.249, 0.207, and 0.801 cts s-1, from top to bottom. Right: hardness ratios as a function of pulse phase derived from the pulse profiles in two neighbouring standard energy bands. |
| In the text | |
|
Fig. 5 Finding chart of SXP11.87. The I-band image from OGLE-II shows the 3 close objects near the X-ray position marked with their OGLE-III identification (arrows). The two lines further mark the likely counter part. The image size is 1 |
| In the text | |
|
Fig. 6 Combined optical-IR flux for our counterpart OGLE-III 14642 at two epochs. a) a historical data set (1999-2002) – solid symbols; b) data set from the time of outburst (Nov.-Dec. 2009) – open symbols. See text for details of the observations. Both data sets are compared to a Kurucz model atmosphere for a B2V star in which this stellar model has been normalised to the outburst B-band point. |
| In the text | |
|
Fig. 7 Multi-wavelength light curves of the XMMU J004814.0-732204/OGLE-III 14642 system. The upper two panels show the MACHO B- and R-bands. In the third panel, the OGLE-III I-band light curve is plotted, with the last data point indicating our own measurement using the Faulkes telescope (see text). Dashed lines indicate the times of X-ray measurements, as shown in the bottom panel. Arrows mark upper limits (XMM-Newton , Chandra, and XMM-Newton in chronological order, see Sect. 3.3), the cross indicates the XMM-Newton detection. |
| In the text | |
|
Fig. 8 Hα spectrum of the OGLE optical candidate #14642 taken 2009 December 11 at SAAO. |
| In the text | |
Current usage metrics show cumulative count of Article Views (full-text article views including HTML views, PDF and ePub downloads, according to the available data) and Abstracts Views on Vision4Press platform.
Data correspond to usage on the plateform after 2015. The current usage metrics is available 48-96 hours after online publication and is updated daily on week days.
Initial download of the metrics may take a while.