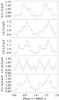
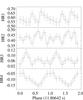
Fig. 4

Left: pulse profiles obtained from the merged EPIC data in different energy bands (for better statistics the first two standard energy bands were combined in the top panel, the bottom panel shows all five energy bands combined). The profiles are background-subtracted and normalised to the average count rate (0.116, 0.228, 0.249, 0.207, and 0.801 cts s-1, from top to bottom. Right: hardness ratios as a function of pulse phase derived from the pulse profiles in two neighbouring standard energy bands.
Current usage metrics show cumulative count of Article Views (full-text article views including HTML views, PDF and ePub downloads, according to the available data) and Abstracts Views on Vision4Press platform.
Data correspond to usage on the plateform after 2015. The current usage metrics is available 48-96 hours after online publication and is updated daily on week days.
Initial download of the metrics may take a while.