Fig. 2
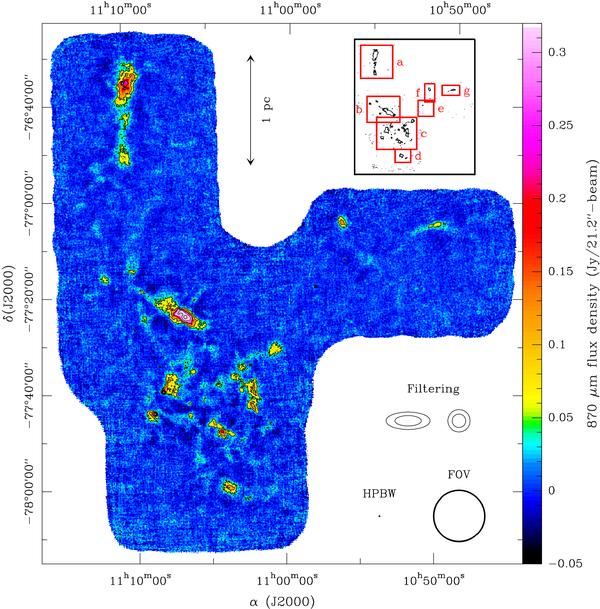
870 μm continuum emission map of Cha I obtained with LABOCA at APEX. The projection type and center are the same as in Fig. 1. The contour levels are a, 2a, 4a, 8a, 16a, and 32a, with a = 48 mJy/21.2″-beam, i.e. about 4 times the rms noise level. The flux density color scale is shown on the right. The field of view of LABOCA (10.7′) and the angular resolution of the map (HPBW = 21.2″) are shown in the lower right corner. The typical sizes above which the filtering due to the data reduction becomes significant in terms of peak flux density are also displayed, for weak (<150 mJy/beam) and strong (>150 mJy/beam) sources with small and large symbols, respectively, and for elliptical sources with aspect ratio 2.5 and circular sources with ellipses and circles, respectively (see Appendix A.1 and Col. 2 of Table A.1). The pixel size is 6.1″. The red boxes in the insert are labeled like Figs. 4a–g and show their limits overlaid on the first 870 μm contour.
Current usage metrics show cumulative count of Article Views (full-text article views including HTML views, PDF and ePub downloads, according to the available data) and Abstracts Views on Vision4Press platform.
Data correspond to usage on the plateform after 2015. The current usage metrics is available 48-96 hours after online publication and is updated daily on week days.
Initial download of the metrics may take a while.