| Issue |
A&A
Volume 527, March 2011
|
|
|---|---|---|
| Article Number | A112 | |
| Number of page(s) | 8 | |
| Section | Stellar structure and evolution | |
| DOI | https://doi.org/10.1051/0004-6361/201015690 | |
| Published online | 04 February 2011 | |
An asteroseismic study of the O9V star HD 46202 from CoRoT space-based photometry⋆
1
Instituut voor Sterrenkunde, K.U.Leuven, Celestijnenlaan 200D,
3001
Leuven,
Belgium
e-mail: This email address is being protected from spambots. You need JavaScript enabled to view it.
2
Department of Astrophysics, IMAPP, University of
Nijmegen, PO Box
9010, 6500 GL
Nijmegen, The
Netherlands
3
LESIA, CNRS UMR8109, Université Pierre et Marie Curie, Université
Denis Diderot, Observatoire de Paris, 92195
Meudon Cedex,
France
4
Max Planck Institute for Astrophysics,
Karl Schwarzschild Str.
1, Garching bei
München
85741,
Germany
5
Dr. Karl Remeis Observatory & ECAP, University of
Erlangen-Nuremberg, Sternwartstrasse 7, 96049
Bamberg,
Germany
6
Institut d’Astrophysique et de Géophysique, University of Liège,
Bât. B5C, Allée du 6 Août
17, 4000
Liège,
Belgium
7
Institut d’Astrophysique Spatiale (IAS),
Bâtiment 121,
91405
Orsay Cedex,
France
Received:
3
September
2010
Accepted:
17
December
2010
Abstract
The O9V star HD 46202, which is a member of the young open cluster NGC 2244, was observed by the CoRoT satellite in October/November 2008 during a short run of 34 days. From the very high-precision light curve, we clearly detect β Cep-like pulsation frequencies with amplitudes of ~0.1 mmag and below. A comparison with stellar models was performed using a χ2 as a measure for the goodness-of-fit between the observed and theoretically computed frequencies. The physical parameters of our best-fitting models are compatible with the ones deduced spectroscopically. A core overshooting parameter αov = 0.10 ± 0.05 pressure scale height is required. None of the observed frequencies are theoretically excited with the input physics used in our study. More theoretical work is thus needed to overcome this shortcoming in how we understand the excitation mechanism of pulsation modes in such a massive star. A similar excitation problem has also been encountered for certain pulsation modes in β Cep stars recently modelled asteroseismically.
Key words: asteroseismology / stars: oscillations / stars: variables: general / stars: early-type / stars: individual: HD 46202
The CoRoT space mission was developed and is operated by the French space agency CNES, with the participation of ESA’s RSSD and Science Programmes, Austria, Belgium, Brazil, Germany, and Spain.
Postdoctoral Fellow of the Fund for Scientific Research of Flanders (FWO), Belgium.
© ESO, 2011
1. Introduction
Asteroseismology is the domain of astrophysics that probes the internal structure of stars by using their stellar oscillations. Different classes of pulsating stars are known across the H-R diagram, including pulsating main-sequence B-type stars (with masses between 3 and 20 M⊙), such as the so-called β Cep stars and the slowly pulsating B stars (e.g., Aerts et al. 2010). Currently, the part of the H-R diagram corresponding to even hotter and more massive main-sequence stars has been poorly explored for asteroseismic purposes, both theoretically and observationally.
Due to lack of firm observational detections, the theory of stellar oscillations has hardly been applied to O star models. On the one hand, one expects, for late O-type stars such as HD 46202 (O9V) studied in this paper, that oscillation modes excited by the κ mechanism occur with periods of several hours, just as for the well-established class of β Cep stars. The theoretical treatment for the lower mass main-sequence O stars is the same as the one for the early-type B stars because stellar winds are not expected to play an important role in the oscillatory behaviour. Radiation-driven winds have thus been ignored when computing instability strips (e.g., Pamyatnykh 1999; Miglio et al. 2007a,b). On the other hand, theory predicts the occurrence of so-called strange mode oscillations in stars close to the Humphreys-Davidson limit. These are due to a convection zone in the outer stellar layers where a density inversion occurs and the radiation pressure dominates (e.g., Glatzel & Kiriakidis 1993; Papaloizou et al. 1997; Saio et al. 1998). Review papers on the topics are available by Glatzel (2009) and by Saio (2009). Observations have not established that there are strange modes in O stars.
On the observational side, there are a few O-type stars for which spectroscopic and photometric variability linked to stellar pulsation has been searched for and found from ground-based data.
Convincing evidence of stellar pulsation has been detected in ζ Oph (Kambe et al. 1997), HD 93521 (Howarth & Reid 1993; Rauw et al. 2008), ξ Persei, and λ Cephei (de Jong et al. 1999). In fact, it is difficult to discover pulsation modes in O-type targets because the observed variability that might come from pulsations has very low amplitude (e.g., Henrichs 1999 for a summary).
In this context clearer detections can be expected from long uninterrupted photometric time series at micro-magnitude precision obtained from space satellites such as CoRoT (Convection, Rotation and planetary Transits, Auvergne et al. 2009). As part of the asteroseismology programme, several O-type stars were observed by CoRoT during the second short run SRa02 pointing towards the anticentre of the Galaxy, e.g., the O-star binaries HD 46149 (Degroote et al. 2010) and HD 47129 (Mahy et al. 2011). In this paper, we present a study of the single O9V star HD 46202, which is a member of the young open cluster NGC 2244 in the Rosette Nebula.
2. Frequency analysis on CoRoT photometry
The CoRoT data of HD 46202 were taken during 34 days between 2008 October 8 and 2008 November 12 with an average time sampling of 32 s. This involves a frequency resolution of ~0.03 d-1. After removing all flagged measurements, such as the ones suffering from hot pixels during the passage through the South Atlantic Anomaly, the light curve consists of 81 781 datapoints. As in most CoRoT light curves, a downward trend considered to be of instrumental origin is visible. Moreover, the light curve presents three jumps during the last five days of observation. We divided the light curve into four parts and, for each of these selected regions, we removed a trend using a linear approximation. To visualise the variability, only part of the detrended light curve is shown in Fig. 1. We can clearly see a variation with a period of the order of 2 days. Moreover, variations on a shorter time scale are also observed.
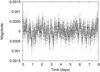 |
Fig. 1 Part of the detrended CoRoT light curve, converted to magnitude (mag = –2.5 log 10(flux), once the average has been substracted). The first datapoint corresponds to 2454759 HJD. |
The Scargle periodogram (Scargle 1982) of the detrended light curve is presented in Fig. 2. Clear peaks are detected between 0.5 and 5 d-1. The peak at 13.97 d-1 is not intrinsic to the star but corresponds to the orbital frequency of the CoRoT satellite. To determine the whole frequency spectrum of the star we used the methodology described in Degroote et al. (2009a), who analysed numerous B-type pulsators using light curves from the exoplanet data of the CoRoT satellite. This methodology uses the usual method of successive prewhitening, along with a statistical stop criterion based on the one first introduced by Scargle (1982). The statistical stop criterion defined in Degroote et al. (2009a) was adopted instead of a signal-to-noise (S/N) criterion (Breger et al. 1993). The reason is that, although a signal originating from nonsinusoidal processes (e.g., red noise) is also considered to be significant, and thus prewhitened using a sum-of-sines model, isolated peaks at lower amplitudes can be recovered outside of these regions.
The frequencies with the highest amplitudes, which turn out to be typical β Cep-like pulsation modes, are listed in Table 1. In addition, all the frequencies with an amplitude lower than the one corresponding to the satellite’s orbital frequency are given in the Appendix. In total 67 frequencies are found to be significant by our adopted stop criterion. For comparison purposes, we also indicate the signal-to-noise (S/N) ratio, which is computed using a 6 d-1 box-interval centred on the considered frequency. The error estimate on the frequency is computed as in Degroote et al. (2009a), i.e., using the formula of Montgomery & O’Donoghue (1999), but also taking correlation effects into account according to the formalism by Schwarzenberg-Czerny (2003).
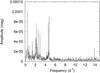 |
Fig. 2 Scargle periodogram of the detrended CoRoT light curve, converted to magnitude. |
The highest-amplitude frequencies derived from the detrended CoRoT light curve after subsequent prewhitening, their corresponding amplitude, and signal-to-noise ratio.
Recent studies of CoRoT light curves of B-type stars highlighted variations in the amplitude of frequencies and in the frequencies themselves as a function of time (e.g., in the β Cep star HD 180642, Degroote et al. 2009b; in the B0.5IVe star HD 49330, Huat et al. 2009). In order to check the stability of the frequencies of HD 46202 listed in Table 1, we applied a short time Fourier transform. Different window widths were used, leading to the conclusion that the frequencies are stable in time. There is no convincing proof of changing amplitudes either. The detected low amplitude variations in time are typical of beating effects for a multiperiodic pulsator (Fig. 3).
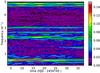 |
Fig. 3 The short time Fourier transform of the detrended CoRoT light curve, computed with a window width of 10 days. The colour scale is in mmag units. |
We searched for rotational frequency splittings with the automatic methods described in Degroote et al. (2009a), but we could not unambiguously or confidently find such multiplets. For the highest amplitude modes, the frequencies f4, f5, and f6 (see Table 1) might belong to the same multiplet and the frequencies f8, f10, and f11 might belong to another one. However, recent work on the β Cep star 12 Lacertae taught us to be cautious in attributing frequencies to multiplets without empirical identification of the mode degree. For this latter target, Dziembowski & Jerzykiewicz (1999) assumed that three of the strongest modes, almost equidistant, belong to the same multiplet in their seismic modelling. Later, a photometric mode identification by Handler et al. (2006) ruled out this assumption by proving that the three modes are actually associated with three different values of the degree ℓ. It is obvious that reliable empirical mode identification from multicolour photometry, and/or spectroscopy, is indispensable for definite conclusions.
CoRoT observations also revealed solar-like oscillations in two massive stars: the β Cep star HD 180642 (Belkacem et al. 2009) and the O-type binary HD 46149 (Degroote et al. 2010). To search for the signature of such oscillations in HD 46202, we performed an autocorrelation of the time series and periodogram, both for the original detrended light curve and for the light curve prewhitened with the highest-amplitude frequencies. We could not find any structure typical of solar-like oscillations with amplitudes above 0.009 mmag.
3. Search for variability in spectra
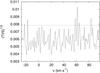 |
Fig. 4 Temporal variance spectrum (TVS) computed from the cross-correlated profiles computed by taking all elements into account, except H. The line corresponds to the 99% significance level for the variability evaluated following the approach of Fullerton et al. (1996). |
Atmospheric parameters, photometric properties and fundamental parameters of HD 46202 as derived from the spectroscopic analysis.
From the photometric amplitudes of the pulsation modes being 0.1 mmag or less, it is clear that these modes cannot be detectable in spectra of moderate S/N. Nevertheless, the study of a time series of spectral lines remains relevant when searching for other kinds of variability. First, we can check for the presence of a variable stellar wind. Also, modes of very high-degree ℓ might be visible in the spectral lines (e.g., as in the β Cep star ω1 Sco, Telting & Schrijvers 1998), although they are not observed in the CoRoT light curve. Additionally, some spectral lines associated to only certain elements might be variable with a periodicity linked to the stellar rotation and magnetic field.
Consequently, we gathered 44 high-resolution spectra (R = 50 000, S/N of ~60) with the CORALIE échelle spectrograph attached to the 1.2 m Leonard Euler telescope (La Silla, Chile). First, variability was searched in individual line profiles. Then, to increase the S/N of the spectra and improve the detection of the line-profile variations, we used cross-correlated profiles computed using the least squares deconvolution (LSD) method (Donati et al. 1997) and taking all elements into account except H. We also computed cross-correlated profiles associated with only one element for all possible elements, such as helium, silicon, nitrogen and oxygen. To perform our frequency analysis, we used the software package FAMIAS1 (Frequency Analysis and Mode Identification for Asteroseismology, Zima 2008). The significance of variability in stellar spectra can be quantified by a temporal variance spectrum (TVS, Fullerton et al. 1996). We computed TVS diagrams for individual line profiles and cross-correlated profiles (Rauw et al. 2001). One of them is illustrated in Fig. 4. Even with such state-of-the-art techniques, no spectroscopic variability could be detected.
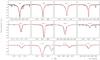 |
Fig. 5 Examples of line fits (red) for H, He, and C to the high-quality observed spectrum (black). The hydrogen and helium lines are reproduced with a single synthetic spectrum, while for carbon a slightly different abundance value is adopted per line, giving rise to a 1-σ uncertainty of 0.10 dex due to line-to-line scatter. |
4. Fundamental parameters
In the next section, we compute stellar models for our target, which match the pulsation frequencies discovered in the CoRoT photometry. The fundamental parameters and chemical composition of HD 46202 are also used as additional constraints. To deduce the latter, we used a high-quality spectrum with extended wavelength coverage, taken with the ESO/MPG 2.2 m telescope with FEROS (Kaufer et al. 1999). Six individual spectra, observed between 2008 April 16–26 of 720 s exposure time each were extracted from the ESO archive and reduced with the MIDAS pipeline. Coaddition of these data gave a spectrum with S/N of more than 500 per resolution element in the optical blue region.
Our quantitative spectral analysis follows the methodology described by Nieva & Przybilla (2007, 2008). In brief, non-LTE line-formation calculations were performed with the codes Detail and Surface (Giddings 1981; Butler & Giddings 1985; both updated by Butler) on the basis of a prescribed LTE atmospheric structure (Atlas9, Kurucz 1993) and accounting for the most recent model atoms of Przybilla et al. (2008). The method is equivalent to full non-LTE model atmosphere analyses for late O-type stars with weak winds (Nieva & Przybilla 2007).
The parameters were determined via simultaneous fitting of all observed H lines and ionisation equilibria of He i/ii and C iii/iv. Our results from the spectral fitting are summarised in Table 2 for the effective temperature Teff, surface gravity log g, microturbulence ξ, and the projected rotational vsini and macroturbulent velocity ζ. Examples of our fits to the observed spectrum are shown in Fig. 5 for these final parameters. Additional models were calculated with the non-LTE code Fastwind (Puls et al. 2005), which accounts for non-LTE metal line blanketing, mass loss, and spherical geometry, for an independent test of the parameter determination. Similar atmospheric parameters were derived from observed H and He i/ii line spectra2, confirming the match of our hydrostatic approach also with hydrodynamical models for late O-type main sequence stars with weak stellar winds. The Fastwind calculations also allowed the mass-loss rate Ṁ from Hα line-profile fits to be constrained. The upper limit found can be considered as insignificant in our comparison with stellar evolutionary models.
The helium, carbon, nitrogen, and magnesium abundances derived with Detail/Surface coincide with the cosmic abundance standard (CAS) from early B-type stars in the solar neighbourhood as proposed by Przybilla et al. (2008). From an extension of that work (Nieva & Przybilla, in prep.) we found evidence that abundance analyses of O, Si, and Fe for late O-type stars require extensions of the model atoms, which is beyond the scope of the present work. We therefore adopt CAS values for these elements, implying mass fractions for hydrogen X, helium Y, and the metals Z in HD 46202 as indicated in Table 2, implicitly assuming that the present surface abundances are representative for the pristine values.
To verify the results from our spectroscopic analysis, we compared our non-LTE model flux with the observed spectral energy distribution of HD 46202 in Fig. 6. For this UV spectrophotometry was extracted from the IUE archive, and Johnson magnitudes were adopted from Morel & Magnenat (1978). The latter were transformed into absolute fluxes using zeropoints from Bessel et al. (1998). The observed flux was dereddened according to the reddening law described by Cardelli et al. (1989), with both the colour excess E(B − V) and the ratio of total-to-selective extinction RV requiring determination. The data were normalised in V. An excellent match of theory with observation is obtained for the values given in Table 2. The strong Lyα line mostly has interstellar origins.
This allowed the dereddened apparent visual magnitude to be determined and the spectroscopic distance dspec to be derived following Ramspeck et al. (2001). The required stellar mass M was obtained by comparison of the star’s position in the log Teff–log g diagram with evolutionary tracks computed as described in Sect. 5 (also the evolutionary age τevol was estimated this way). This in turn facilitated the absolute visual magnitude MV to be determined, along with the bolometric magnitude Mbol, the stellar luminosity L, and the stellar radius R, by using the bolometric correction BC from our model. Thus, a fully consistent spectroscopic solution for the fundamental stellar parameters of HD 46202 was established, as summarised in Table 2.
In consequence, HD 46202 is an unevolved star close to the zero-age main sequence, which shows no signature of mixing with CN-processed material (Przybilla et al 2010). The derived colour excess, RV, distance, and age are in excellent agreement with the NGC 2244 cluster properties determined by Hensberge et al. (2000).
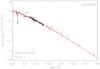 |
Fig. 6 Fit of the Detail non-LTE model flux for our finally adopted parameters from Table 2 (red line) to the observed spectral energy distribution of HD 46202 (black line, squares) from the UV to the near-IR. The observations have been dereddened and normalised in V. |
5. Comparison with stellar models
We checked that state-of-the-art stellar models with standard physics can account for the frequency spectrum observed by CoRoT. When X and Z are fixed, we attempted to asteroseismically constrain the model parameters of HD 46202, which are the mass, the central hydrogen abundance (or age), and the core convective overshooting parameter.
5.1. Numerical tools and model input physics
Stellar models for non-rotating stars were computed with the evolutionary code CLÉS (Code Liégeois d’Évolution Stellaire, Scuflaire et al. 2008a). We used the OPAL2001 equation of state (Rogers & Nayfonov 2002; Caughlan & Fowler 1988), with nuclear reaction rates from Formicola et al. (2004) for the 14N(p,γ)15O cross-section. Convective transport is treated by using the classical mixing length theory of convection (Böhm-Vitense 1958). For the chemical composition, we used the solar mixture from Asplund et al. (2005). We used OP opacity tables (Seaton 2005) computed for this mixture. These tables are completed at log T < 4.1 with the low-temperature tables of Ferguson et al. (2005).
When X ∈ [0.682,0.748] and Z ∈ [0.013,0.015] were adopted (Przybilla et al. 2008), a fine grid of stellar evolutionary models was computed for a mass between 16 and 28 M⊙ in steps of 0.1 M⊙ and a core convective overshooting parameter αov between 0 and 0.5 pressure scale heights in steps of 0.05. For each main-sequence stellar model, we calculated the theoretical frequency spectrum of low-order p- and g-modes with a degree of the oscillation up to ℓ = 4 using a standard adiabatic code for non-rotating stellar models (Scuflaire et al. 2008b).
5.2. Matching the highest-amplitude frequencies
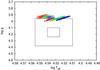 |
Fig. 7 The 1-σ and 3-σ error boxes represent the position of HD 46202, deduced from spectroscopy, in the log Teff–log g diagram. The positions of all the asteroseismic models having a χ2 ≤ 2 are also shown, for X = 0.682 (in red), X = 0.715 (in green), and X = 0.748 (in blue). We refer to the text for more explanations. |
To each model of our computed grid of stellar evolutionary models, we assigned a χ2-value, which compares the observed frequencies  to the theoretically computed ones
  , as follows:
 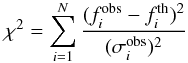 (1)where
  is the observational uncertainty. The lower the χ2-value, the better the match between observed and predicted frequencies. We selected the observed frequencies with only the highest amplitudes, as listed in Table 1. The χ2-value is computed, and the theoretical frequency value is the closest to the observed one. Because of the lack of mode identification, no restriction on the degree ℓ was imposed on the theoretical frequencies, which correspond to zonal modes (m = 0).
In Fig. 7 the positions of all the models having a χ2 ≤ 2, without any a priori restriction on log Teff, but with log g ≥ 3.89, are compared to the error box representing the position of HD 46202 in the log Teff–log g diagram, as spectroscopically deduced.
We conclude that the positions of our best-fitting models are compatible with the spectroscopic one. Indeed, the discrepancy found in log g can be considered as small in view of current uncertainties in the theory of stellar structure and stellar atmospheres. Despite great efforts have been made to identify and reduce numerous systematic errors of atmospheric parameters related to the data reduction, spectral modelling, and spectral analysis (see Nieva & Przybilla 2010, for a summary), the remaining systematics cannot be excluded.
One of the main factors in this context is the unknown true rotational velocity vrot of HD 46202. The star shows an exceptionally low vsini for the massive star population of NGC 2244, where about 30% of the stars have vsini > 250 km s-1 (Huang & Gies 2006), indicating a large fraction of truly fast rotators. The measured vsini of HD 46202 is only a lower limit, since vrot may reach much higher values if the star is seen nearly pole-on. The spectroscopically derived log g would be the polar value in that case, while the average log g on the surface of the rotationally deformed star could be significantly lower. Fast rotation would require not only a re-interpretation of the spectroscopically derived parameters but also consideration of non-standard physics in the stellar structure and evolutionary models (see e.g. Ekström et al. 2008), with additional consequences for the predicted frequency spectrum and its excitation. We conclude that the potential nature of HD 46202 as a fast rotator seen nearly pole-on could resolve the remaining discrepancy between the spectroscopic and asteroseismic solutions. The way to check this would be to gather a very high-resolution time series (typically R ~ 100 000 of high S/N (>300) spectroscopy covering the beat pattern of the oscillations). In this way, a spectroscopic mode identification can be achieved with certainty and, along with it, an estimate of the inclination angle of the star.
We note that a similar shift in log g was also obtained for the β Cep star θ Ophiuchi (Briquet et al. 2007). For this target, the identification of a fundamental radial mode could pinpoint the seismic log g-value while the spectroscopic log g-value was found to be about 0.15 dex higher.
5.3. Most probable model parameters
In Fig. 7, we distinguish two groups of models, shown as open squares and as filled circles. Looking deeper into the theoretical frequency spectrum of these two groups, we conclude that the most probable models are those represented as open squares in Fig. 7. Our arguments are the following.
For the models shown as filled circles, the theoretical frequencies matching the observed frequencies of Table 1 correspond to ℓ = 3 or ℓ = 4 modes only, except for the frequency f6 which has an ℓ = 1. It is very unlikely that no mode with ℓ = 0 and ℓ = 2 is observed among the highest amplitudes modes. The reverse scenario, i.e. with only ℓ = 0,1,2 modes among the highest amplitude modes, is certainly more plausible for reasons of cancellation effects for higher degree modes.
The models shown as open squares fit f2 = 4.856 d-1 as the fundamental radial mode, f3 = 4.691 d-1 as an (ℓ,n) = (2, −1) mode and f6 = 3.004 d-1 as an (ℓ,n) = (1, −1) mode. For the modes with lower frequency values, the theoretical frequency spectrum is denser, so an unambiguous identification is more difficult. Our best-fitting model has a mass between 23.3 and 24.9 M⊙ and a core convective overshooting parameter between 0.05 and 0.15 pressure scale heights. The other physical parameters are given in Table 3.
Physical parameters of HD 46202 as derived from the asteroseismic modelling, X ∈ [0.682,0.748] and Z ∈ [0.013,0.015].
5.4. Checking the excitation of the modes
For all models represented in Fig. 7, we checked the excitation of the pulsation modes with the linear non-adiabatic code MAD developed by Dupret et al. (2002). We found that none of the observed frequencies is theoretically excited using the input physics described in Sect. 5.1.
Such an excitation problem has already been encountered for other massive stars. For instance, the two β Cep stars 12 Lacertae (B2III) and ν Eridani (B2III) present observed modes that have not yet been predicted by pulsation models, although different attempts to solve the discrepancies between theory and observations have been suggested in the literature. We refer to Dziembowski & Pamyatnykh (2008), and references therein, for the latest discussion of the matter. Another choice of opacity table (e.g. OPAL opacities) and/or metal mixture (e.g. Grevesse & Noels 1993) does not reconcile the observed and excited model frequencies for HD 46202. Miglio et al. (2007a,b) show that more modes are found to be excited in pulsating B-type stars when using OP opacities with the Asplund et al. (2005) mixture, as adopted in our study, compared to the case where the OPAL opacities are considered. To solve shortcomings in our understanding of excitation mechanisms in massive stars and, in HD 46202 in particular, is beyond the scope of this paper but deserves to be addressed in depth. One explanation might be that current opacities are still underestimated in the region where the driving of pulsation modes occurs.
6. Conclusions
The space white-light CoRoT photometry reveals the presence of β Cep-like pulsations of very small amplitudes (~0.1 mmag and below) in the O9V star HD 46202. By means of CoRoT data, variability associated to stellar pulsations, albeit of a different nature, was also detected in the O-type binary HD 46149 (Degroote et al. 2010) and in Plaskett’s star (Mahy et al. 2011). These discoveries unambiguously prove there are stellar oscillations in O-type stars, while opening the way for promising asteroseismic modelling of this kind of massive star.
For HD 46202, we found stellar models compatible with the observed asteroseismic (pulsation frequencies) and non-asteroseismic constraints (effective temperature and surface gravity). For the model that best explains the observed oscillations, the frequency f2 = 4.856 d-1 is identified as the fundamental radial mode. Empirical mode identification is desirable in order to confirm this conclusion and to identify the wavenumbers (ℓ,m) of other modes. This task is, however, challenging because of the very low amplitude of the modes.
Another challenge concerns the excitation of the modes. Even using OP opacities with the Asplund et al. (2005) solar mixture, none of the observed frequencies of HD 46202 is predicted to be excited by non-adiabatic computations, which explain, at least in general, the excitation of the modes in the less massive pulsating B stars. Miglio et al. (2007a,b) extensively explored the impact of the choice of opacity tables and metal mixtures on the instability domains for stars with masses between 2.5 and 18 M⊙ and for different metallicity values Z. Similar studies for higher masses, also including mass loss, are necessary for a comparison with the newly discovered oscillations in massive O-type stars from space data with unprecedented quality. Our observational results presented here form a good basis for such a theoretical study. Moreover, a detailed exploration of the physics in the outer layers leading to the opacity-driven modes detected in the O9V star HD 46202 and the modes of stochastic nature detected in the O8.5V star HD 46149 will allow an in-depth evaluation of the various excitation mechanisms that seem to be at work in slowly rotating O-type stars in the main-sequence phase.
Appendix A: The frequencies of HD 46202 detected in the CoRoT light curve
The frequencies derived from the detrended CoRoT light curve after subsequent prewhitening, their corresponding error, amplitude, phase, and signal-to-noise ratio.
FAMIAS has been developed in the framework of the FP6 European Coordination Action HELAS – http://www.helas-eu.org/
A comprehensive analysis of the metal line spectrum is not feasible with Fastwind at present.
Acknowledgments
We thank Andrea Miglio for providing us his code to compute the χ2 function. The research leading to these results has received funding from the European Research Council under the European Community’s Seventh Framework Programme (FP7/2007–2013)/ERC grant agreement n°227224 (PROSPERITY), from the Research Council of K.U. Leuven, from the Fund for Scientific Research of Flanders, and from the Belgian federal science policy office Belspo. F.S. acknowledges financial support by the “Studienstiftung des deutschen Volkes”. We thank the GAPHE team of the department of Astrophysics, Geophysics and Oceanography of the University of Liège for providing us their code to compute the temporal variance spectrum.
References
- Aerts, C., Christensen-Dalsgaard, J., & Kurtz, D. W. 2010, Asteroseismology (Springer) [Google Scholar]
- Asplund, M., Grevesse, N., & Sauval, A. J. 2005, in Cosmic abundances as records of stellar evolution and nucleosynthesis, ed. T. G. Barnes III, & F. N. Bash, ASP Conf. Ser., 336, 25 [Google Scholar]
- Auvergne, M., Bodin, P., Boisnard, L., et al. 2009, A&A, 506, 411 [NASA ADS] [CrossRef] [EDP Sciences] [Google Scholar]
- Belkacem, K., Samadi, R., Goupil, M.-J., et al. 2009, Sci, 324, 1540 [Google Scholar]
- Bessell, M. S., Castelli, F., & Plez, B. 1998, A&A, 333, 231 [NASA ADS] [Google Scholar]
- Böhm-Vitense, E. 1958, Zeitsch. Astrophys., 46, 108 [Google Scholar]
- Breger, M., Stich, J., Garrido, R., et al. 1993, A&A, 271, 482 [NASA ADS] [Google Scholar]
- Briquet, M., Morel, T., Thoul, A., et al. 2007, MNRAS, 381, 1482 [NASA ADS] [CrossRef] [Google Scholar]
- Butler, K., & Giddings, J. R. 1985, in Newsletter of Analysis of Astronomical Spectra, No. 9 (Univ. London) [Google Scholar]
- Cardelli, J. A., Clayton, G. C., & Mathis, J. S. 1989, ApJ, 345, 245 [NASA ADS] [CrossRef] [Google Scholar]
- Caughlan, G. R., & Fowler, W. A. 1988, Atomic Data and Nuclear Data Tables, 40, 283 [Google Scholar]
- Degroote, P., Aerts, C., Ollivier, M., et al. 2009a, A&A, 506, 471 [NASA ADS] [CrossRef] [EDP Sciences] [Google Scholar]
- Degroote, P., Briquet, M., Catala, C., et al. 2009b, A&A, 506, 111 [NASA ADS] [CrossRef] [EDP Sciences] [Google Scholar]
- Degroote, P., Briquet, M., Auvergne, M., et al. 2010, A&A, 519, A38 [NASA ADS] [CrossRef] [EDP Sciences] [Google Scholar]
- de Jong, J. A., Henrichs, H. F., Schrijvers, C., et al. 1999, A&A, 345, 172 [NASA ADS] [Google Scholar]
- Donati J.-F., Semel M., Carter B. D., Rees D. E., & Collier Cameron A. 1997, MNRAS, 291, 658 [NASA ADS] [CrossRef] [MathSciNet] [Google Scholar]
- Dupret, M.-A., De Ridder, J., Neuforge, C., Aerts, C., & Scuflaire, R. 2002, A&A, 385, 563 [NASA ADS] [CrossRef] [EDP Sciences] [Google Scholar]
- Dziembowski, W. A., & Jerzykiewicz, M. 1999, A&A, 341, 480 [NASA ADS] [Google Scholar]
- Dziembowski, W. A., & Pamyatnykh, A. A. 2008, MNRAS, 385, 2061 [NASA ADS] [CrossRef] [Google Scholar]
- Ekström, S., Meynet, G., Maeder, A., & Barblan, F. 2008, A&A, 478, 467 [NASA ADS] [CrossRef] [EDP Sciences] [Google Scholar]
- Ferguson, J. W., Alexander, D. R., Allard, F., et al. 2005, ApJ 623, 585 [NASA ADS] [CrossRef] [Google Scholar]
- Formicola, A., Imbriani, G., Costantini, H., et al. 2004, Phys. Lett. B, 591, 61 [NASA ADS] [CrossRef] [Google Scholar]
- Fullerton, A. W., Gies, D. R., & Bolton, C. T. 1996, ApJS, 103, 475 [NASA ADS] [CrossRef] [Google Scholar]
- Giddings, J. R. 1981, Ph.D. Thesis (Univ. London) [Google Scholar]
- Glatzel, W. 2009, CoAst, 158, 252 [Google Scholar]
- Glatzel, W., & Kiriakidis, M. 1993, MNRAS, 263, 375 [NASA ADS] [Google Scholar]
- Grevesse, N., & Noels, A. 1993, in Origin and evolution of the elements, ed. N. Prantzos, E. Vangioni-Flam, & M. Casse (Cambridge University Press), 14 [Google Scholar]
- Handler, G., Jerzykiewicz, M., Rodríguez, E., et al. 2006, MNRAS, 365, 327 [NASA ADS] [CrossRef] [Google Scholar]
- Henrichs, H. F. 1999, LNP, 523, 304 [NASA ADS] [Google Scholar]
- Hensberge, H., Pavlovski, K., & Verschueren, W. 2000, A&A, 358, 553 [NASA ADS] [Google Scholar]
- Howarth, I. D., & Reid, A. H. N. 1993, A&A, 279, 148 [NASA ADS] [Google Scholar]
- Huang, W., & Gies, D. R. 2006, ApJ, 648, 580 [NASA ADS] [CrossRef] [Google Scholar]
- Huat, A.-L., Hubert, A.-M., Baudin, F., et al. 2009, A&A, 506, 95 [NASA ADS] [CrossRef] [EDP Sciences] [Google Scholar]
- Kambe, E., Hirata, R., Ando, H., et al. 1997, ApJ, 481, 406 [NASA ADS] [CrossRef] [Google Scholar]
- Kaufer, A., Stahl, O., Tubbesing, S., et al. 1999, Messenger, 95, 8 [Google Scholar]
- Kurucz, R. L. 1993b, CD-ROM No. 13 (Cambridge, Mass.: SAO) [Google Scholar]
- Mahy, L., Gosset, E., Baudin, F., et al. 2011, A&A, 525, A101 [NASA ADS] [CrossRef] [EDP Sciences] [Google Scholar]
- Miglio, A., Montalbán, J., Dupret, M.-A. 2007a, MNRAS, 375, L21 [NASA ADS] [CrossRef] [Google Scholar]
- Miglio, A., Montalbán, J., Dupret, M.-A. 2007b, CoAst, 151, 48 [NASA ADS] [Google Scholar]
- Montgomery, M. H., & O’Donoghue, D. 1999, Delta Scuti Star Newsletter, 13, 28 [NASA ADS] [Google Scholar]
- Morel, M., & Magnenat, P. 1978, A&AS, 34, 477 [NASA ADS] [Google Scholar]
- Nieva, M. F., & Przybilla, N. 2007, A&A, 467, 295 [NASA ADS] [CrossRef] [EDP Sciences] [Google Scholar]
- Nieva, M. F., & Przybilla, N. 2008, A&A, 481, 199 [NASA ADS] [CrossRef] [EDP Sciences] [Google Scholar]
- Nieva, M. F., & Przybilla, N. 2010, ASP Conf. Ser., 425, 146 [NASA ADS] [Google Scholar]
- Pamyatnykh, A. A. 1999, AcA, 49, 119 [NASA ADS] [Google Scholar]
- Papaloizou, J. C. B., Alberts, F., Pringle, J. E., & Savonije, G. J. 1997, MNRAS, 284, 821 [NASA ADS] [Google Scholar]
- Przybilla, N., Nieva, M. F., & Butler, K. 2008, ApJ, 688, L103 [NASA ADS] [CrossRef] [Google Scholar]
- Przybilla, N., Firnstein, M., Nieva, M. F., Meynet, G., & Maeder, A. 2010, A&A, 517, A38 [NASA ADS] [CrossRef] [EDP Sciences] [Google Scholar]
- Puls, J., Urbaneja, M. A., Venero, R., et al. 2005, A&A, 435, 669 [NASA ADS] [CrossRef] [EDP Sciences] [Google Scholar]
- Ramspeck, M., Heber, U., & Moehler, S. 2001, A&A, 378, 907 [NASA ADS] [CrossRef] [EDP Sciences] [Google Scholar]
- Rauw, G., Morrison, N. D., Vreux, J.-M., Gosset, E., & Mulliss, C. L. 2001, A&A, 366, 585 [NASA ADS] [CrossRef] [EDP Sciences] [Google Scholar]
- Rauw, G., De Becker, M., van Winckel, H., et al. 2008, A&A, 487, 659 [NASA ADS] [CrossRef] [EDP Sciences] [Google Scholar]
- Rogers, F. J., & Nayfonov, A. 2002, ApJ, 576, 1064 [Google Scholar]
- Saio, H. 2009, CoAst, 158, 245 [Google Scholar]
- Saio, H., Baker, N. H., & Gautschy, A. 1998, MNRAS, 294, 622 [NASA ADS] [CrossRef] [Google Scholar]
- Scargle, J. D. 1982, ApJ, 263, 835 [NASA ADS] [CrossRef] [Google Scholar]
- Schwarzenberg-Czerny, A. 2003, in Interplay of Periodic, Cyclic and Stochastic Variability in Selected Areas of the H-R Diagram, ed. C. Sterken, ASP Conf. Ser., 292, 383 [Google Scholar]
- Scuflaire, R., Théado, S., Montalbán, J., et al. 2008a, Ap&SS, 316, 83 [NASA ADS] [CrossRef] [Google Scholar]
- Scuflaire, R., Montalbán, J., Théado, S., et al. 2008b, Ap&SS, 316, 149 [NASA ADS] [CrossRef] [Google Scholar]
- Seaton, M. J. 2005, MNRAS, 362, L1 [NASA ADS] [CrossRef] [Google Scholar]
- Telting, J. H., & Schrijvers, C. 1998, A&A, 339, 150 [NASA ADS] [Google Scholar]
- Zima, W. 2008, CoAst, 157, 387 [Google Scholar]
All Tables
The highest-amplitude frequencies derived from the detrended CoRoT light curve after subsequent prewhitening, their corresponding amplitude, and signal-to-noise ratio.
Atmospheric parameters, photometric properties and fundamental parameters of HD 46202 as derived from the spectroscopic analysis.
Physical parameters of HD 46202 as derived from the asteroseismic modelling, X ∈ [0.682,0.748] and Z ∈ [0.013,0.015].
The frequencies derived from the detrended CoRoT light curve after subsequent prewhitening, their corresponding error, amplitude, phase, and signal-to-noise ratio.
All Figures
|
Fig. 1 Part of the detrended CoRoT light curve, converted to magnitude (mag = –2.5 log 10(flux), once the average has been substracted). The first datapoint corresponds to 2454759 HJD. |
| In the text | |
|
Fig. 2 Scargle periodogram of the detrended CoRoT light curve, converted to magnitude. |
| In the text | |
|
Fig. 3 The short time Fourier transform of the detrended CoRoT light curve, computed with a window width of 10 days. The colour scale is in mmag units. |
| In the text | |
|
Fig. 4 Temporal variance spectrum (TVS) computed from the cross-correlated profiles computed by taking all elements into account, except H. The line corresponds to the 99% significance level for the variability evaluated following the approach of Fullerton et al. (1996). |
| In the text | |
|
Fig. 5 Examples of line fits (red) for H, He, and C to the high-quality observed spectrum (black). The hydrogen and helium lines are reproduced with a single synthetic spectrum, while for carbon a slightly different abundance value is adopted per line, giving rise to a 1-σ uncertainty of 0.10 dex due to line-to-line scatter. |
| In the text | |
|
Fig. 6 Fit of the Detail non-LTE model flux for our finally adopted parameters from Table 2 (red line) to the observed spectral energy distribution of HD 46202 (black line, squares) from the UV to the near-IR. The observations have been dereddened and normalised in V. |
| In the text | |
|
Fig. 7 The 1-σ and 3-σ error boxes represent the position of HD 46202, deduced from spectroscopy, in the log Teff–log g diagram. The positions of all the asteroseismic models having a χ2 ≤ 2 are also shown, for X = 0.682 (in red), X = 0.715 (in green), and X = 0.748 (in blue). We refer to the text for more explanations. |
| In the text | |
Current usage metrics show cumulative count of Article Views (full-text article views including HTML views, PDF and ePub downloads, according to the available data) and Abstracts Views on Vision4Press platform.
Data correspond to usage on the plateform after 2015. The current usage metrics is available 48-96 hours after online publication and is updated daily on week days.
Initial download of the metrics may take a while.