Free Access
Fig. 4
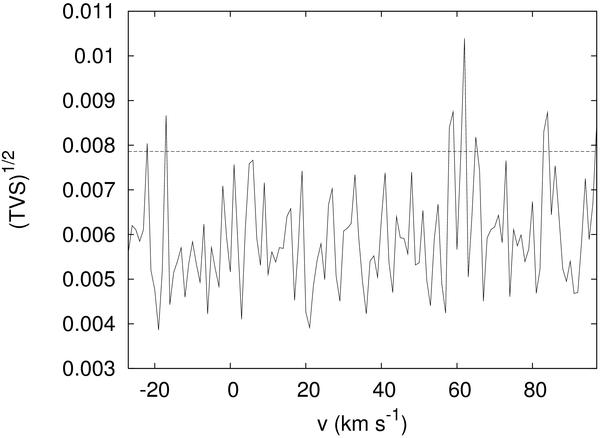
Temporal variance spectrum (TVS) computed from the cross-correlated profiles computed by taking all elements into account, except H. The line corresponds to the 99% significance level for the variability evaluated following the approach of Fullerton et al. (1996).
Current usage metrics show cumulative count of Article Views (full-text article views including HTML views, PDF and ePub downloads, according to the available data) and Abstracts Views on Vision4Press platform.
Data correspond to usage on the plateform after 2015. The current usage metrics is available 48-96 hours after online publication and is updated daily on week days.
Initial download of the metrics may take a while.