Fig. 8
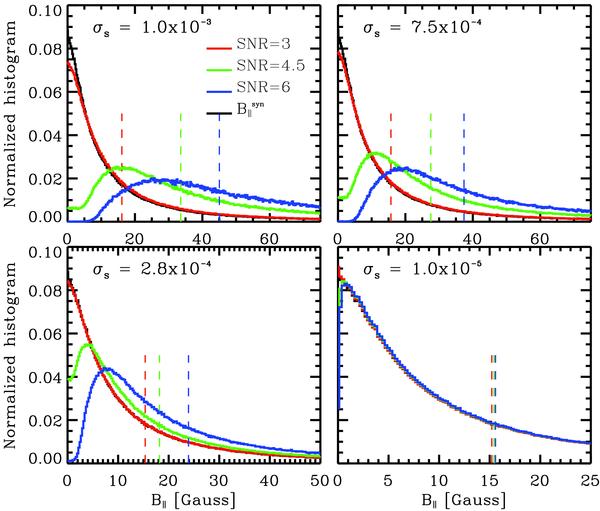
Histograms for the original longitudinal component of the magnetic field  used in the synthesis of the simulated data (black). The retrieved distributions from the inversion are indicated by the color lines: SNR ≥ 3 (red), SNR ≥ 4.5 (green) and SNR ≥ 6 (blue). The CoG of the retrieved histograms are indicated by the vertical dashed lines. Each panel shows the results for different levels of noise: σs = 10-3 (as in observed map A; upper-left), σs = 7.5 × 10⁻⁴ (as in observed map B; upper-right), σs = 2.8 × 10⁻⁴ (as in observed map C; lower-left), and finally σs = 10-5.
Current usage metrics show cumulative count of Article Views (full-text article views including HTML views, PDF and ePub downloads, according to the available data) and Abstracts Views on Vision4Press platform.
Data correspond to usage on the plateform after 2015. The current usage metrics is available 48-96 hours after online publication and is updated daily on week days.
Initial download of the metrics may take a while.