Fig. 6
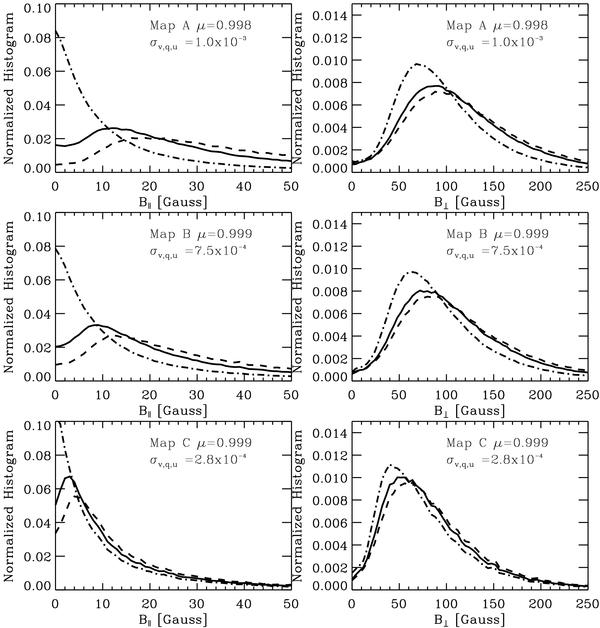
Histograms for the longitudinal component of the magnetic field B∥ (left panels) and the transverse component of the magnetic field B ⊥ (right panels). The first row corresponds to map A, while the second corresponds to map B, and the third represents map C. Dashed-dotted, solid and dashed lines correspond to a SNR-threshold of 3, 4.5, and 6, respectively.
Current usage metrics show cumulative count of Article Views (full-text article views including HTML views, PDF and ePub downloads, according to the available data) and Abstracts Views on Vision4Press platform.
Data correspond to usage on the plateform after 2015. The current usage metrics is available 48-96 hours after online publication and is updated daily on week days.
Initial download of the metrics may take a while.