Fig. 3
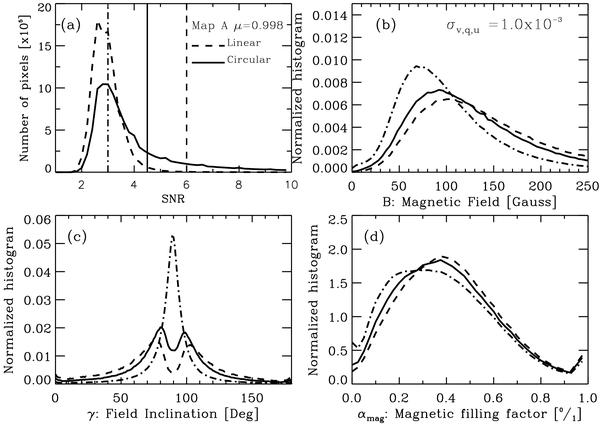
Panel a) histogram for the number of pixels as a function of the signal-to-noise ratio in the polarization profiles. Circular polarization (Stokes V) is indicated by the solid line, while the linear polarization ( ) is shown dashed. Panel b) histogram for the magnetic field strength
  . Panel c) histogram for the inclination of the magnetic field vector γ. Panel d) histogram for the magnetic filling factor αmag. In the last three panels, the dashed lines display the histograms obtained from those pixels where any of three polarization profiles has an SNR ≥ 3, whereas solid and dashed lines represent SNR ≥ 4.5,6, respectively. These thresholds are also indicated with vertical lines in panel a. This figure corresponds to map A, where the characteristic noise level is σs = 10-3.
Current usage metrics show cumulative count of Article Views (full-text article views including HTML views, PDF and ePub downloads, according to the available data) and Abstracts Views on Vision4Press platform.
Data correspond to usage on the plateform after 2015. The current usage metrics is available 48-96 hours after online publication and is updated daily on week days.
Initial download of the metrics may take a while.