Free Access
Fig. 2
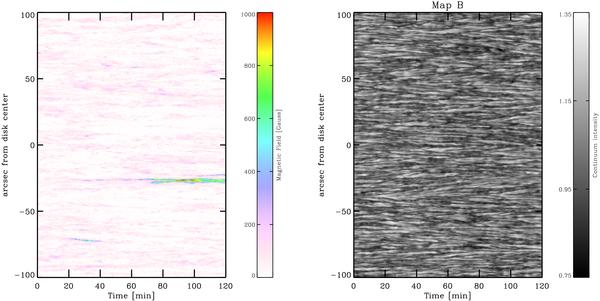
Observed continuum intensity (upper panel) and mean magnetic field strength at each pixel inferred from the inversion of the Stokes profiles (lower panel). Note that the spectrograph’s slit was always located at the same position on the Sun, therefore the horizontal axis refers to time. See Sect. 2.2 for details.
This figure is made of several images, please see below:
Current usage metrics show cumulative count of Article Views (full-text article views including HTML views, PDF and ePub downloads, according to the available data) and Abstracts Views on Vision4Press platform.
Data correspond to usage on the plateform after 2015. The current usage metrics is available 48-96 hours after online publication and is updated daily on week days.
Initial download of the metrics may take a while.