| Issue |
A&A
Volume 527, March 2011
|
|
|---|---|---|
| Article Number | A150 | |
| Number of page(s) | 16 | |
| Section | Extragalactic astronomy | |
| DOI | https://doi.org/10.1051/0004-6361/201015565 | |
| Published online | 15 February 2011 | |
A survey of HC3N in extragalactic sources
Is HC3N a tracer of activity in ULIRGs?⋆
1
Centre for Star and Planet Formation, Natural History Museum of Denmark,
University of Copenhagen,
Øster Voldgade 5-7,
1350
Copenhagen K,
Denmark
e-mail: This email address is being protected from spambots. You need JavaScript enabled to view it.
2
Nordic Optical Telescope, Apartado 474, 38700 Santa Cruz de La
Palma, Santa Cruz de
Tenerife, Spain
3
Department of Earth and Space Sciences, Onsala Observatory,
Chalmers University of Technology, 439 92
Onsala,
Sweden
4
Max-Planck-Institut für Radioastronomie,
Auf dem Hügel 69,
53121
Bonn,
Germany
5
Kapteyn Astronomical Institute, University of Groningen,
Landleven 12,
9747 AD
Groningen, The
Netherlands
6
California Institute of Technology, 1200 E. California Blvd., Mail Code 301-17,
Pasadena, CA
91125-4700,
USA
Received: 11 August 2010
Accepted: 16 December 2010
Abstract
Context. HC3N is a molecule that is mainly associated with Galactic star-forming regions, but it has also been detected in extragalactic environments.
Aims. To present the first extragalactic survey of HC3N, when combining earlier data from the literature with six new single-dish detections, and to compare HC3N with other molecular tracers (HCN, HNC), as well as other properties (silicate absorption strength, IR flux density ratios, C ii flux, and megamaser activity).
Methods. We present mm IRAM 30 m, OSO 20 m, and SEST observations of HC3N rotational lines (mainly the J = 10–9 transition) and of the J = 1–0 transitions of HCN and HNC. Our combined HC3N data account for 13 galaxies (excluding the upper limits reported for the non-detections), while we have HCN and HNC data for more than 20 galaxies.
Results. A preliminary definition “HC3N-luminous galaxy” is made based upon the HC3N/HCN ratio. Most (~80%) HC3N-luminous galaxies seem to be deeply obscured galaxies and (U)LIRGs. A majority (~60% or more) of the HC3N-luminous galaxies in the sample present OH mega- or strong kilomaser activity. A possible explanation is that both HC3N and OH megamasers need warm dust for their excitation. Alternatively, the dust that excites the OH megamaser offers protection against UV destruction of HC3N. A high silicate absorption strength is also found in several of the HC3N-luminous objects, which may help the HC3N to survive. Finally, we find that a high HC3N/HCN ratio is related to a high dust temperature and a low C ii flux.
Key words: galaxies: ISM / galaxies: starburst / galaxies: active / radio lines: galaxies / radio lines: ISM / ISM: molecules
Appendix is only available in electronic form at http://www.aanda.org
J.L. wishes to thank Instrumentcenter for Danish Astrophysics (IDA) for grant support.
S.A. wishes to thank the Swedish Research Council for grant support.
F.C. wishes to thank the EU ESTRELA programme for support.
© ESO, 2011
1. Introduction
Finding useful tracers of the interaction between the activity in galaxy nuclei and surrounding interstellar medium (ISM) is an important and growing aspect of current extragalactic molecular astronomy. In this context, single dish surveys of polar molecules such as HCN, HNC, HCO+, and CS have been used to investigate possible correlations between molecular line ratios and type/intensity of activity (e.g. Kohno et al. 2001; Aalto et al. 2002; Imanishi et al. 2004; Graciá-Carpio et al. 2006; Krips et al. 2008; Baan et al. 2008). For example, it has been suggested that an elevated HCN/HCO+ 1–0 line intensity ratio indicates the presence of an AGN (Graciá-Carpio et al. 2006). Around an active galactic nucleus (AGN) the chemistry is supposedly dominated by hard X-rays in an X-ray dominated region (XDR), and some chemical models predict an abundance enhancement of HCN paired with selective destruction of HCO+ (Maloney et al. 1996) – which could lead to an elevated HCN/HCO+ line ratio (under the circumstances that the line ratio directly reflects the abundance ratio). However, more recent chemical models instead suggest that HCO+ is enhanced in XDRs (Meijerink & Spaans 2005; Meijerink et al. 2007), and HCO+ is also expected to be under-abundant in regions of very young star formation (Aalto 2008), so the line ratio is ambiguous.
Other molecular tracers could help resolve the dichotomy of the HCN/HCO+ line ratio. The serendipitous discovery of the J = 10–9 line of HC3N near the HNC J = 1–0 line in a survey by Aalto et al. (2002) led us to look more closely at this molecule. HC3N is the simplest of the cyanopolyynes (carbon chains with an attached CN group) and is a grain chemistry product, in contrast to molecules such as HCN and HCO+. HC3N thrives in warm, dense shielded regions such as hot cores where abundances can reach 10-8 or even higher, since it is easily destroyed by photo-dissociation (Rodriguez-Franco et al. 1998) and C+ ions (Prasad & Huntress 1980). Therefore, HC3N line emission could be used to identify galaxies where star formation is in the early, embedded stage of its evolution. Recently, HC3N was found in high abundance in the highly obscured galaxy NGC 4418 (Aalto et al. 2007), as well as the ULIRG Arp 220 (Aalto et al. 2002).
We have searched for HC3N line emission in a sample of galaxies in various stages and types of activity: AGNs, starbursts, and ultraluminous galaxies (ULIRGs). In some of the galaxies the nature of the activity is elusive since it is embedded in huge columns of dust absorbing emission at optical and infrared wavelengths. In some cases, the extinction is so strong that no emission emerges at optical or IR wavelengths requiring us to probe the nature of the activity at radio and mm wavelengths. HC3N has a rich mm and sub-mm wavelength spectrum consisting of a multitude of rotational and vibrational lines often appearing close to each other in the same band. Through its vibrational transitions, HC3N responds strongly to the IR field from dusty nuclei (Costagliola & Aalto 2010). Therefore, combining the rotational and vibrational line information of HC3N allows us to study the abundance of HC3N (comparing with chemical models of XDRs and starbursts) as well as the intensity and temperature structure of the buried IR source.
Rotational lines of vibrationally excited HC3N have recently been discovered in a few galaxies (NGC 4418 (Costagliola & Aalto 2010), Arp 220 (Martín et al. 2011), and IC 860 (Costagliola et al. 2011)), therefore showing that it is important to take both radiative and collisional excitation into consideration when interpreting HC3N line emission from IR luminous galaxies.
It can also be noted that absorption lines of HC3N has been found in a z ~ 0.89 galaxy located in front of the quasar PKS 1830-211 (Henkel et al. 2009).
1.1. Outline
Here, the first survey of extragalactic HC3N data is presented. We report new HC3N observations in 19 galaxies (detections in six of them), mainly (U)LIRGs and starburst galaxies, and complete this sample with data from all earlier extragalactic HC3N emission line single-dish detections found in the literature. The aim of the study is to compare the HC3N luminosity with other molecular tracers as well as galaxy properties to see if the presence of HC3N can be used to predict other galaxy properties, e.g. the source of activity in the galaxy.
In Sect. 2, the general properties of HC3N in space are discussed. In Sect. 3 we present the new observations and discuss the collection of data from the literature. In Sect. 4 we present the results in terms of line intensities and line ratios. In Sect. 5 we discuss the interpretation of the HC3N results and compare them with silicate absorption strength (Sect. 5.2), OH megamaser activity (Sect. 5.3), IR flux density ratios (Sect. 5.4), C ii flux (Sect. 5.5), and the HNC/HCN 1-0 line ratio (Sect. 5.6). In Sect. 5.7 future studies resulting from this project are discussed.
2. HC3N in space
2.1. Generation of HC3N
Acetylene, C2H2, exists on grains in the ISM (Chapman et al. 2009). After evaporating from the grains there are at least two different paths the C2H2 may follow. If a high UV field is present (the region being a PDR), it will photo-dissociate into the ethynyl radical, C2H (Meier & Turner 2005; Cherchneff et al. 1993; Heikkilä et al. 1999):  (1)If no strong UV field is present (no PDR), but CN (the cyano radical) is available for reactions, the C2H2 will instead react with the CN to form HC3N (Meier & Turner 2005; Chapman et al. 2009; Fukuzawa & Osamura 1997):
  (2)This hypothesis is strengthened by interferometric maps of HC3N and C2H in IC 342 found in Meier & Turner (2005). The maps show a clear anti-correlation between the distributions of the molecules. Using the abundances of HC3N, C2H, and CN in a region where it is expected that grains with C2H2 first were present, it should therefore be possible to tell whether a strong UV field is present or not.
Irvine et al. (1987) find that C2H, contrarily to HC3N, is two orders of magnitude more abundant in the Orion ridge than in its hot core. Possibly, the hot core shields the HC3N and C2H2 from photo-dissociating into C2H. Some of the C2H2 instead reacts with the CN (although not very abundant) and forms even more HC3N. The highest HC3N abundances are found in Sgr B2 hot cores, being in the order of 10-7 of the H2 abundance (de Vicente et al. 2000).
We have not included all possible HC3N formation mechanisms here, and investigations of other processes are ongoing, as for example the notion of ice formation of HC3N (Szczepanski et al. 2005).
2.2. Destruction of HC3N
In the Galaxy, HC3N is associated with warm, dense, shielded gas around young stars or star-forming regions, and is easily destroyed by UV radiation and reactions with C+ ions (Rodriguez-Franco et al. 1998; Meier & Turner 2005). It will form either C2H or C3N when being photo-dissociated (Cherchneff et al. 1993), and C3H+ or C4N+ when reacting with C+ (Bohme & Raksit 1985). Among the possible reactions destroying HC3N are: 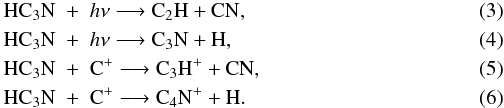 Reaction rates of these reactions, as well as those in Sect. 2.1, can be found in e.g. Cherchneff et al. (1993).
Data for the observations reported in this work.
2.3. Abundances of HC3N
Irvine et al. (1987) give the relative abundances of several molecules in the core and ridge of the Orion molecular cloud. The detections of these molecules in the Galaxy are indicative of their abundances in high and low density molecular regions. The relative HC3N abundance lies around 10-9 of the H2 abundance in the core (dense region), and 10-10 in the ridge (low density region). This is a relatively small difference between high and low density regions, as compared to e.g. HCN, with about 10-7 of the H2 abundance in the core, and 10-9 in the ridge.
The intense radiation from starburst regions and/or AGNs in the centre of many galaxies will turn surrounding gas clouds into regions where the chemical structure depends highly on the radiation field, either photon-dominated regions (PDRs) or X-ray dominated regions (XDRs). In XDRs the abundance of several molecules (e.g. CN and CH2) are expected to be enhanced with respect to the abundance commonly found in PDRs. Due to the high C+ abundance in XDRs, a low HC3N abundance is expected (Aalto 2008). The HC3N/CN abundance ratio found in PDRs is also very low compared to the same ratio measured in hot, dense cores (Rodriguez-Franco et al. 1998). For further discussion about PDR and XDR chemistry, see e.g. Tielens & Hollenbach (1985); Lepp & Dalgarno (1996); Meijerink & Spaans (2005); Maloney et al. (1996).
3. Observations
The new observations reported in this work were carried out with the IRAM 30 m1, OSO 20 m, and SEST 15 m telescopes between 2001 and 2008. Detailed lists with system temperatures and dates for the observations reported in this work are found in Table 1). The pointing accuracy was better than 2′′ for all the observations, and typical system temperatures were 150 K (IRAM 90–110 GHz), 250 K (IRAM 125 GHz), 400 K (IRAM 225–250 GHz), and 300 K (OSO and SEST). In this survey we also include data from the literature using the already mentioned telescopes, as well as the NRO 45 m, NRAO 12 m, and FCRAO 14 m telescopes. Whenever using data from the literature, the beam sizes and efficiencies given in the respective articles have been used for calculations of line ratios. The parameters used for all new observations reported in this work are given in Table 2.
One could argue that the many different instruments used to obtain the data in this article might introduce a bias difficult to compensate for. However, when comparing the HNC/HCN 1–0 line ratios obtained with IRAM and SEST respectively, no systematic bias is detected. The average line ratio was calculated to 0.51 ± 0.11 for SEST data and 0.51 ± 0.08 for IRAM data.
Observational parameters.
All objects investigated (observed by us or with data from the literature) are listed in Table 3, along with some important characteristics.
The relative HC3N abundances calculated in this work will be expressed as line ratios between an HC3N line (mostly the J = 10–9 transition) and the J = 1–0 transitions of HCN and HNC. These two molecules are chosen as they are good tracers of high density regions (see e.g. Papadopoulos 2007; Aalto et al. 2002), where we expect to find the HC3N (Meier & Turner 2005). Also, HCN and HNC data are available for most of the objects in the sample. We note that the line ratios are not linearly proportional to ratios between the abundances of the species, since they will also depend on excitation conditions and optical depths in the galaxies. A high HC3N/HCN ratio might thus sometimes be a tracer of discrepancies in temperatures, densities, or IR pumping in the galaxies.
List of investigated objects and some of their properties. For the galaxies with new observations reported, the given positions are those used for our observations. For objects not observed by us the position in NED (2009) is given.
Data from HC3N observations.
Data from HCN 1-0 observations.
Data from HNC 1-0 observations.
A discussion of the method used when calculating the line ratios can be found in Appendix A. A few of the most nearby galaxies in the survey have such a large angular distribution that the measured values might not represent a global value for molecular gas in the galaxy, but rather a value for a certain (central) region of the galaxy. This effect is discussed in Appendix A.1.
The sample of galaxies observed by us has been chosen to have a high probability of finding HC3N – it is by no means intended to be an unbiased sample of some random galaxies, and thus the relatively high detection ratio should definitely not reflect the amount of HC3N-luminous galaxies in the universe. The same is most likely true for the galaxies found in the literature. Another important selection effect for the objects from the literature is that detections are much more likely to be reported than non-detections, which also leads to a biased sample.
To increase the chance of detecting HC3N, almost all of the galaxies that were chosen to be part of the sample have earlier detections of HCN, which means that they should have large amounts of dense gas, increasing the possibility of finding HC3N. As the goal of the study is to investigate if HC3N can trace the source of the activity in active galaxies, the sample consists only of active galaxies – starburst galaxies and AGN galaxies (the source of the activity is although disputed or unknown in many of the galaxies in the sample).
Throughout the article, the  scale will be used for all our data. For the data from the literature, the temperature scale used in each article will be used in our tables, clearly noted whenever the scale is not used. This will make it easier to detect any errors that might have occurred in the survey work. When the line ratios are calculated, the efficiencies will be taken into account properly.
Data analysis was performed with the X-Spec2 software package. A first order baseline was subtracted from all spectra.
4. Results
All new HC3N, HCN, and HNC spectra reported in this work are displayed in Figs. 1–7. The observed values of the spectral line intensities can be found in Tables 4–6. Data from the literature are also included in these tables.
 |
Fig. 1 HC3N 10-9 spectra for Arp 220, IRAS 17208-0014 (detections), NGC 2146 (non-detection), NGC 3079 (detection), and UGC 5101 (non-detection). For Arp 220 and IRAS 17208-0014, part of the HNC 1-0 line is also visible. Some of the reported HC3N 10-9-detections are found in the HNC 1-0 spectra, see Fig. 7. |
 |
Fig. 2 HC3N 12-11 spectra for Arp 220 (detection), IC 694 (non-detection), Maffei 2 (detection), NGC 2146, NGC 2623, NGC 3690, and NGC 6946 (non-detections). |
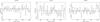 |
Fig. 3 HC3N 16-15 spectra for NGC 1056, NGC 1377, and NGC 3079 (non-detections). The absorption-like features in the NGC 1056 spectrum are most likely due to a problem with the backend of the receiver. |
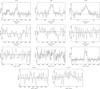 |
Fig. 7 HNC 1-0 spectra for Circinus, IC 860, IRAS 17208-0014 (detections), NGC 34, NGC 613, NGC 1056, NGC 1377, NGC 1614 (non-detections), NGC 4945 (detection), NGC 5135, and UGC 5101 (non-detections). For Circinus, the HC3N 10-9 line is also visible. Bandwidths for the spectra of NGC 34, NGC 613, NGC 1614, and NGC 5135 are broad enough to include non-detections of the HC3N 10-9 line, thus giving upper limits for these lines. |
Some observations of HC3N 10-9 and HNC 1-0 performed with SEST include both these lines in the same spectrum, due to the large bandwidth. The spectra are in these cases labelled according to the central peak. The frequency difference between the two peaks is 315 MHz, as can be seen in Table 2. This gives a velocity difference of approximately 1000 km s-1.
4.1. New detections
This is not only the first text to put together a survey of all extragalactic HC3N emission line data, but it also reports the first HC3N detections in six galaxies: Circinus, IC 860, IRAS 17208-0014, Maffei 2, NGC 1068, and NGC 3079. The number of extragalactic sources where HC3N has been detected is thus almost doubled. Three of the HNC detections are also made in sources without earlier HNC detections: Circinus, IC 860, and IRAS 17208-0014. Finally, the first detection of HCN in NGC 613 is also reported.
4.2. Line ratios
Calculated line ratios.
The line ratios have been calculated using the method described in Appendix A, and are shown in Table 7. As already mentioned, the HC3N/HCN and HC3N/HNC line ratios of some of the most nearby galaxies will be somewhat overestimated due to their source size being larger than the beam size of the telescope. See Appendix A.1 for a discussion on this subject. The galaxies in our survey that do not fulfil the criterion θs ≲ θmb are IC 342, M82, Maffei 2, and NGC 253, and we therefore expect the real HC3N/HCN and HC3N/HNC ratios to be somewhat lower for these galaxies.
In Table 7, preference has been given to HC3N 10-9 lines before other HC3N lines. Only if no 10-9 line is available, another HC3N line (specified in the footnotes) has been used for the ratios.
A few of the galaxies appear twice in Table 7. For these, several observations have been found for the same transition. As can be seen, the values of these observations do not always agree. If the HC3N and HNC data are found in the same spectrum in one of the observations, preference has been given to this observation, as it will increase the accuracy on the HC3N/HNC ratio. In all other cases, the spectrum of each observation has been investigated (when available), and the values from the spectra with the lowest noise levels have been given priority and are put first in Table 7.
4.2.1. HC3N-luminous galaxies
A definition of an HC3N-luminous galaxy is now desirable. As HCN is the most common dense gas tracer, and also should be a more stable component of the dense gas than HNC, the HC3N/HCN ratios were decided to be used for this definition. It seems like most galaxies have HC3N/HCN ratios below 0.15, with the exception for a few interesting galaxies. Thus, we consider in the rest of the paper that galaxies with  are HC3N-luminous galaxies. If a corresponding limit should be set on the HC3N/HNC ratio, it would be around 0.25 to include the same galaxies.
The galaxies thus seen as HC3N-luminous or HC3N-rich are NGC 4418, IC 342, Circinus, M82, Maffei 2, Arp 220, and IRAS 17208-0014. We also choose to include IC 860, considering that its moderate HC3N/HNC ratio is for the HC3N 28-27 transition, as the higher transitions seem to be weaker than the J = 10-9 line in most galaxies where more than one line has been observed (when beam effects are compensated for). A few of these galaxies are quite nearby, and as discussed above, the HC3N/HCN ratio of galaxies with source sizes larger than the telescope beam size will probably be overestimated. This is particularly the case for M82, IC 342, and Maffei 2.
Some galaxies can definitely be seen as HC3N-poor, since they have HC3N/HCN ratios (or upper limits for this ratio) less than or equal to 0.10: NGC 253, NGC 1068, NGC 1808, NGC 3256, NGC 4945, NGC 6946, and UGC 5101. Since NGC 253 also belongs to the nearby galaxies, this value should probably be even lower.
5. Discussion
It is not surprising to find that most galaxies in our sample from published articles show HC3N detections – otherwise they would not be submitted for publication. However, if only counting the galaxies first investigated by us, there are only 6 HC3N detections in the 19 galaxies. This sample of galaxies was nevertheless made to find a high number of HC3N-luminous galaxies. This could mean one of three things:
-
Our search-criteria for HC3N-luminous galaxies are not appropriate.
-
The limit for HC3N-luminous galaxies is set too high to include all “interesting” objects.
-
HC3N-luminous galaxies are very rare, even among active galaxies.
Several possible correlations between a high HC3N intensity and other properties of the galaxies have been examined. This will be discussed below.
5.1. In which types of galaxies do we find HC3N?
If the HC3N-rich and -poor galaxies are compared with the galaxy classifications of Table 3, the most obvious trend is that most of the HC3N-poor galaxies are starbursts, with the exception for the LIRG UGC 5101. It is difficult to see any trend for the AGNs due to the low number of such objects in the sample.
When removing the nearby galaxies from the HC3N-rich category due to their overestimated HC3N/HCN-ratios mentioned earlier, the common denominator of the remaining galaxies seems to be that their source of activity is unknown or disputed – they are labelled as “obscured” or ULIRGs. Thus, HC3N might thrive in deeply obscured, shielded regions, where it cannot be destroyed by radiation. In starbursts, it might be destroyed by the strong UV field – or not even created, as C2H2 on the grains will photo-dissociate into C2H (see Sect. 2.1).
5.2. Silicate absorption strength
In Spoon et al. (2002), several absorption features from ice and silicates as well as emission from PAHs in active galaxies are discussed. In Spoon et al. (2007), an evolutionary plot for active galaxies is produced, showing two distinct regions in a plot over the equivalent width of the PAH 6.2 μm emission line versus the strength of the silicate 9.7 μm absorption band. Starburst galaxies tend to have a high PAH equivalent width, Seyfert galaxies have low PAH equivalent width and low silicate absorption strength, while ULIRGs have high silicate absorption strength and often also low PAH equivalent width.
By private communication with H. W. W. Spoon, the numerical values for silicate absorption strength in all the galaxies in his sample were obtained. Most galaxies in our sample are also included in his sample. When comparing these values to our HC3N/HCN ratios, a tentative pattern seems to appear.
In Fig. 8, the relation between the HC3N/HCN ratio and the silicate absorption strength is plotted. We note that two of the three nearby galaxies in the sample, M82 and IC 342, are showing too high HC3N/HCN ratios to fit into the pattern of the figure, which was expected (see Appendix A.1). A correlation seems possible when excluding the nearby M82, NGC 253, and IC 342 (correlation coefficient r = − 0.49). One explanation to the correlation might be that HC3N is formed in regions with silicates, where the silicates protect the HC3N from radiation. Thus, HC3N survives better in regions heavily obscured by silicates.
 |
Fig. 8 Tentative correlation between HC3N/HCN ratio and silicate absorption strength. The HC3N/HCN values for IC 342, NGC 253, and M82 are probably overestimated (indicated by thinner error bars, see Appendix A.1). The objects for which the HC3N 12-11 line has been used instead of the HC3N 10-9 line when calculating the HC3N/HCN ratio are indicated by a star. The silicate absorption strength is in a magnitude scale: A higher negative number means stronger silicate absorption. |
5.3. Megamasers
Neglecting the most nearby galaxies, where the HC3N/HCN ratios probably are somewhat overestimated, all HC3N-luminous galaxies have OH mega- or kilomasers (Darling & Giovanelli 2006). A few of the HC3N-poor galaxies also have OH mega- or kilomaser activity (NGC 253, NGC 1068, and UGC 5101). The concept of defining megamaser strength only from its luminosity is however somewhat misleading. Firstly, a galaxy with much molecular gas is more likely to harbour a strong megamaser than one with little molecular gas – the data in Darling (2007) show a strong correlation between OH megamaser strength and CO and HCN luminosity. Thus, it is more reasonable to normalise the OH megamaser luminosity with some kind of luminosity for the molecular gas in the galaxy. The CO 1-0 luminosity has been chosen for this, since CO is the primary tracer of molecular gas.
OH maser luminosities and CO luminosities for some of the sources in the sample.
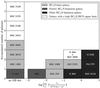 |
Fig. 9 Histogram over number of galaxies in normalised OH megamaser luminosity. Light-grey corresponds to galaxies considered HC3N-poor, medium-gray corresponds to nearby HC3N-luminous galaxies whose HC3N/HCN ratios probably are overestimated (see Appendix A.1), dark-grey corresponds to all other HC3N-luminous galaxies, and white corresponds to galaxies where the upper limit on the HC3N/HCN ratio is too high to tell whether it is HC3N-luminous or not. The galaxies for which OH maser emission is non-detected in Darling & Giovanelli (2002) and/or Darling (2007) are stacked in the leftmost column of the histogram. |
For IC 860, no CO 1-0 luminosity value has been found in the literature, but from an observation performed with the IRAM 30 m telescope by F. Costagliola the luminosity could be calculated from the intensity with the method described in Solomon et al. (1997). The used equation is:  (7)where LCO is the line luminosity in K km s-1 pc2, Ωs ∗ b is the solid angle of the source convolved with the telescope beam in arcsec2, DL is the luminosity distance in Mpc, ICO is the main beam intensity of the line in K km s-1, and z is the redshift of the source. The intensity 9.83 K km s-1, the beam width 22′′, and the distance 59.1 Mpc gives a luminosity of 3.07 × 10⁸ K km s-1 pc2, assuming that the source size is much smaller than the beam size, which is valid for IC 860.
In Table 8, the OH megamaser luminosity is compared with the CO luminosity. The data in this table is also shown in the form of a histogram in Fig. 9. The non-detections of OH megamasers and OH absorbers reported in Darling (2007) are also listed, most of them being either HC3N-poor or without any HC3N detection (the exceptions are IC 342 and M82, whose HC3N/HCN ratios probably are overestimated, see Appendix A.1).
It can be seen that the OH megamaser luminosities normalised with the galactic CO luminosities are much higher in the HC3N-luminous galaxies than in the HC3N-poor galaxies with an OH megamaser, especially when ignoring the nearby galaxies M82 and IC 342. The average of the OH/CO luminosity ratios is more than 10 times higher in the HC3N-luminous galaxies than in the HC3N-poor galaxies. The non-detections (where HC3N-poor galaxies are overrepresented) are not included in these averages. UGC 5101 is the only HC3N-poor galaxy with an OH megamaser that is strong compared to the amount of molecular gas in the galaxy. Also without the CO normalisation the trend can be seen clearly.
A possible explanation of the HC3N correlating with OH megamasers is that the HC3N is protected against destructive UV radiation by the warm dust which is needed to power the megamaser (Darling & Giovanelli 2006). Another possibility is that the HC3N is pumped by the IR field caused by the warm dust, which also pumps the OH megamaser.
5.4. IR flux density ratios
In several of the HC3N rich galaxies, rotational-vibrational HC3N lines have been detected (Costagliola & Aalto 2010; Martín et al. 2011; Costagliola et al. 2011). This suggests that IR pumping of the emission is present in these galaxies, which in turn indicates a warmer spectral energy distribution (SED) in these sources. We have thus compared the HC3N/HCN ratios with the IRAS 60 μm/100 μm flux density ratios, but no linear correlation could be found. However, when plotting the data as a histogram (Fig. 10), we see a trend towards HC3N-luminous galaxies having higher IRAS 60 μm/100 μm ratios, corresponding to warmer SEDs. NGC 4418, the object with the highest HC3N/HCN ratio in the sample is also the galaxy with the highest IRAS 60 μm/100 μm ratio.
It should however be mentioned that the global 60 μm/100 μm flux density ratios might not be completely relevant, since they may tell more about the temperature on the extended dust distribution (and/or foreground dust) than the dust temperature in the nucleus, where the pumping likely occurs.
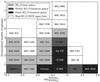 |
Fig. 10 Histogram over number of galaxies in IRAS 60 μm/100 μm flux density ratio. Light-grey corresponds to galaxies considered HC3N-poor, medium-gray corresponds to nearby HC3N-luminous galaxies whose HC3N/HCN ratios probably are overestimated (see Appendix A.1), dark-grey corresponds to all other HC3N-luminous galaxies, and white corresponds to galaxies where the upper limit on the HC3N/HCN ratio is too high to tell whether it is HC3N-luminous or not. IRAS 60 μm/100 μm flux density values are all from Sanders et al. (2003), except for Circinus and Maffei 2, which are from Beichman et al. (1988). |
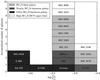 |
Fig. 11 Histogram over number of galaxies in C ii flux normalised by FIR flux. Light-grey corresponds to galaxies considered HC3N-poor, medium-gray corresponds to nearby HC3N-luminous galaxies whose HC3N/HCN ratios probably are overestimated (see Appendix A.1), dark-grey corresponds to all other HC3N-luminous galaxies, and white corresponds to galaxies where the upper limit on the HC3N/HCN ratio is too high to tell whether it is HC3N-luminous or not. FIR fluxes were calculated from IRAS 60 μm and 100 μm fluxes with the method described in Bizyaev (2001). The references for the used IRAS fluxes are given in the caption of Fig. 10. C ii flux values are from Negishi et al. (2001), except for IC 342 and NGC 3079 (Stacey et al. 1991); IC 860 and NGC 4418 (Malhotra et al. 2001); Arp 220 (Luhman et al. 2003); and NGC 1614 (Brauher et al. 2009). |
5.5. C ii flux
 |
Fig. 12 log-log plot of the HC3N/HCN line ratio versus the HNC/HCN line ratio. The HC3N/HCN values for IC 342, Maffei 2, M82, and NGC 253 are probably overestimated (indicated by thin error bars, see Appendix A.1). The objects for which the HC3N 12-11 line has been used instead of the HC3N 10-9 line when calculating the HC3N/HCN ratio are indicated by a star. |
Many of the objects with high HC3N/HCN ratios also have low C ii/FIR flux ratios. This can be explained by that the C+ ions are able to destroy HC3N through reactions 5 and 6 in Sect. 2.2. We have searched in the literature for available C ii fluxes of the objects, which were found for more than half of the objects in our sample. With the limited amount of data, no linear correlation could be established. Instead, we display the data in the form of a histogram in Fig. 11, where we clearly see that a majority of the HC3N-rich galaxies are very poor in C ii flux. We also see that the nearby galaxies for which the high HC3N/HCN ratio we expected to be an over-estimation due to beam effects (see Appendix A.1) all belong to the C ii rich part of the histogram. Also in this case, NGC 4418 is the most extreme galaxy, with the lowest upper limit on the C ii/FIR flux ratio.
5.6. HNC/HCN
The HNC/HCN 1-0 ratio is an indicator of the physical and chemical conditions in the dense molecular gas. Overluminous HNC is a sign of XDR chemistry (Aalto 2008), while a low HNC/HCN ratio indicates shocks (Schilke et al. 1992). As is seen in Fig. 12, we find a correlation between the HC3N/HCN and HNC/HCN 1-0 line ratios. The HC3N/HCN ratios of M82, Maffei 2, IC 342, and NGC 253 are probably overestimated (see Appendix A.1), and the correlation coefficient is r = 0.65 when these four objects are excluded. This correlation will be further discussed in Costagliola et al. (2011).
Attempts were also made trying to find a correlation between the HC3N ratios and ratios of higher HNC and HCN transitions, e.g. the HNC/HCN 3-2 ratio. However, too few HNC 3-2 and HCN 3-2 spectra for the galaxies in the sample are available in the literature – with only five data points no conclusions can be drawn. It was although noticed that the HCN 3-2 and HNC 3-2 intensities seem to be very uncertain, at least for Arp 220 and NGC 4418. Shortly, it seems like the different instruments used for the observations affect the measured value to a non-negligible extent. This is further discussed in Lindberg (2009).
We were not able to reproduce the weak correlation between the HNC/HCN 1-0 ratio and the FIR luminosity described in Aalto et al. (2002).
5.7. Future observational tests
We have found a strong trend between the HC3N/HCN ratio and OH megamaser activity (see Sect. 5.3). By studying different excitation levels of HC3N in these and other OH megamaser galaxies, the cause of this correlation can be investigated. If HC3N is pumped, higher transitions, including vibrational transitions, should be found. This has already been detected in NGC 4418 (Costagliola & Aalto 2010).
To better establish the importance of HC3N as an indicator of activity in certain galaxies, it is important to do further line surveys of HC3N, HCN, and HNC, as well as other molecules who trace the properties of the molecular gas, such as HCO+ and C2H. Such a line survey could also test our weak correlation between the HC3N/HCN and HNC/HCN line ratios, and perhaps finding other correlations which would enable a better understanding of the chemistry in obscured and active galaxies. A new line survey was made with the new EMIR receiver at the IRAM 30 m telescope in June 2009, and the results from this survey will be published in Costagliola et al. (2011). The sample in this survey has been chosen to get more HC3N data on sources in Spoon’s sample to test the possible correlations between the HC3N/HCN ratio and PAH equivalent width and/or silicate absorption strength. The bandwidth of the EMIR receiver allows for several spectral lines being observed in the same spectrum, and thus many different molecular species can be observed at the same time.
It might also be interesting to search for other long-carbon-chain molecules in the HC3N-luminous galaxies, e.g. HC5N, C2H, C4H, C3H2, and C4H2, which have all been found in star-forming regions in the Galaxy (Sakai et al. 2008, 2009).
Finally, we suggest mapping of HC3N, C2H, HCN, and HNC in a larger number of galaxies, especially in the HC3N-luminous galaxies, to compare the results with the maps of IC 342 in Meier & Turner (2005). The HC3N absorption lines detected in a z ~ 0.89 galaxy in front of PKS 1830-211 (Henkel et al. 2009) indicate that HC3N is not only present in the core of a galaxy, but may also be present in the disc.
6. Conclusions
We have presented the first survey of HC3N observations in extragalactic objects. The main conclusions from this survey are as follows:
-
1.
Bright HC3N emission is rather uncommon in galaxies. It was only detected in 6 of the 19 galaxies which had not been investigated before, even though that sample was selected to find many HC3N-luminous galaxies.
-
2.
Most HC3N-luminous galaxies are obscured galaxies. Starburst galaxies seem to be poor in HC3N. There are too few AGN galaxies in the sample to tell if these normally are rich or poor in HC3N.
-
3.
A weak correlation can be seen between the HC3N/HCN ratio and silicate 9.7 μm absorption strength.
-
4.
There is a strong correlation between OH megamaser activity and HC3N luminosity. Most HC3N-luminous galaxies have an OH megamaser. This could be related to a high dust obscuration in the HC3N-luminous galaxies.
-
5.
There is a connection between the HC3N/HCN ratio and the IRAS 60 μm/100 μm flux density ratios, indicating a higher dust temperature in these galaxies, which could cause vibrational excitation of the HC3N molecule.
-
6.
There is a strong connection between a high HC3N/HCN ratio and a low C ii/FIR flux ratio in the studied objects. This could be explained by C+ ions being required to destroy the HC3N molecule.
-
7.
There is a correlation between the HC3N/HCN and HNC/HCN line ratios.
Online material
Appendix A: Line ratios and source sizes
We have calculated the line ratios between the observed HC3N, HCN, and HNC lines, and the used method will be demonstrated in this appendix. The method accounts for beam size/source size effects, using the following formula for a line ratio between the spectral lines A and B:  (A.1)where θmb is the main beam half-power beam width (or main beam size) of the telescope, ηmb is the main beam efficiency of the telescope, θs is the source size of the observed object, and
  is the integrated intensity of the signal. The temperature can also be given in Tmb scale – in this case, the main beam efficiency corresponding to that observation should be omitted since
  .
.
Some of the galaxies have very large angular distributions. The measured intensities might in these few cases not represent a global value for molecular gas in the galaxy, but rather a value for a certain (central) region of the galaxy. This will be discussed in Sect. A.1. If the different observations for the same galaxy are made in different parts of the galaxies the line ratios might be misleading. The exact positions of observation are given in most of the references, and these have been compared. The largest difference in position between two observations in the same galaxy is for IC 342, which has a 3′′ difference between the HCN observation in Sorai et al. (2002) and the HNC and HC3N observations in Henkel et al. (1988). Compared to the sizes of HNC and HC3N distribution (Meier & Turner 2005) as well as the used beam sizes (19′′ and 25′′), this offset is although rather small. For all other galaxies, the position difference is at most 1′′.
Another issue is that two molecules compared in a line ratio might not have the same spatial distributions, and too narrow a beam might exclude more flux from one molecule than from the other. The problem gets even greater if the two molecular lines are observed with two different beam sizes. The problem mainly affect the most nearby galaxies in the sample, whose source sizes are comparable with the used beam sizes.
The size of the dense molecular region is also important when converting from measured temperature to brightness temperature, and as a consequence of this also when computing the line ratios between two transitions in a galaxy when different telescopes have been used. When available, the source size has been estimated from tables or maps showing the HCN source size, thus assuming that the HCN source size is similar to the source sizes of the other molecules used in the line ratio calculations (HNC and HC3N) as all these lines are expected to be present only in the dense molecular regions (Meier & Turner 2005). When an HCN source size has not been found, the source size of the CO emission has been used instead. Preference has then been given to the higher CO transitions, as these are better tracers of dense gas than CO 1-0, which traces much thinner molecular gas, giving too high a value on the source size. The source sizes used in this work are shown in Table 3, and unless no transition is stated, HCN 1-0 should be assumed.
For some of the galaxies no reliable value on the source size (neither HCN nor CO) has been found. This might still not be a problem when calculating the line ratios. In Sect. A.2 it will be shown that the error when assuming a point source is less than 5% for objects more distant than 45 Mpc, and less than 10% for objects more distant than 30 Mpc. These errors are calculated for a line ratio made with the most different beam sizes used in this work. When the beam sizes of the telescopes used for the observations are (almost) the same, the source sizes will just cancel. In any case, this error should be smaller than errors introduced by the use of so many different telescopes and instruments.
A.1. Nearby galaxies
As mentioned above, some of the most nearby galaxies have source sizes larger than the beam size of the telescope used for the observation. When calculating molecular line ratios, this might pose a problem. Only if we expect the distributions of the two molecules to have the same shape and size, and the observations are made with the same beam sizes, we will achieve the same ratio as for a global measurement on the galaxy. In particular, we expect the HC3N to be concentrated in a smaller region of the galaxy than HCN and HNC (Meier & Turner 2005), which makes the calculations of these ratios depend on the beam size to be large enough to cover the whole dense molecular region of the galaxy (e.g. the whole HCN region).
If the beam size is smaller than the HCN (or HNC) emitting region, but larger than the HC3N region, the HC3N/HCN (or HC3N/HNC) ratio will be overestimated, as all HC3N will be seen, but not all HCN (or HNC). However, if the opposite would be true, the HC3N/HCN and HC3N/HNC instead would be underestimated. But since HCN and HNC are more abundant than HC3N in all studied sources, this seems very unlikely.
Not knowing the HC3N source size will also affect the line ratios from the more distant galaxies to some extent, since the source size used for the line ratio calculations is an HCN source size (in a few cases even a CO source size) also for the HC3N intensities. However, assuming the proportion between the HCN and HC3N source sizes to be similar for all galaxies, this will affect all line ratios in the same way, thus making all line ratios a little bit too high.
Another problem for the line ratios of the nearby galaxies is that the two different observations used to calculate a line ratio sometimes are made with different beam sizes. When comparing HCN 1-0, HNC 1-0, and HC3N 10-9 observations made with the same telescopes the difference in source size is negligible, but if a line ratio is calculated from observations from two different telescopes the two molecular intensities are observed towards regions with different sizes. For distant galaxies this is not a problem, since the whole molecular region of the galaxy is unresolved in any beam. For the more nearby galaxies, one of the molecules might be observed more or less globally in the galaxy, while the other is observed very locally in the galactic centre, giving an erroneous line ratio. The galaxies affected by this issue should be the same as those affected by the previously mentioned beam size issue.
A.2. Unknown source sizes
The source sizes used in this study are found in Table 3. However, for some sources no reliable value for the source size has been found. We will here discuss why this is not always a problem, and estimate sizes of the errors inflicted from not knowing the source size.
As can be seen above, the line ratios depend on the source and beam sizes with the factor  . The source size θs can be ignored if both beam sizes θmbA,θmbB ≫ θs. If the beam sizes θmbA ≈ θmbB, the source size will also cancel. However, if θs is comparable to the beam sizes, and θmbA and θmbB are non-similar, the source size becomes an important factor.
The error when assuming the source to be point-like, e.g. setting θs = 0, will be  (A.2)For the sources where an HCN source size has been used, the corresponding source diameter has never exceeded 1.6 kpc (NGC 2146). For the CO source sizes, the largest is found in NGC 5135, with a source diameter of 4.1 kpc in CO 1-0, but the HCN source sizes should be smaller than this.
Assuming no larger HCN source diameter than 1.6 kpc, and the largest and smallest beam sizes at 90 GHz (SEST with 57′′ and IRAM with 28′′), the error will be less than 5 % for distances greater than 45 Mpc, and less than 10 % for distances greater than 30 Mpc. Thus, even for objects closer than 30 Mpc, the error caused by the point-like approximation (θs = 0) is notable only if the θmb of the two observations used to calculate the ratio have notably different sizes (at least a 30% difference in beam sizes is needed to produce an error of 10 %).
Based on observations carried out with the IRAM 30m Telescope. IRAM is supported by INSU/CNRS (France), MPG (Germany), and IGN (Spain).
Acknowledgments
Many thanks to the IRAM, OSO, and SEST staff for their help during the observations. We are grateful to H. W. W. Spoon for sharing his PAH and silicate data with us. We would also like to thank the anonymous referee for several useful suggestions which improved the manuscript.
References
- Aalto, S. 2008, Ap&SS, 313, 273 [NASA ADS] [CrossRef] [Google Scholar]
- Aalto, S., Booth, R. S., Black, J. H., Koribalski, B., & Wielebinski, R. 1994, A&A, 286, 365 [NASA ADS] [Google Scholar]
- Aalto, S., Booth, R. S., Black, J. H., & Johansson, L. E. B. 1995, A&A, 300, 369 [NASA ADS] [Google Scholar]
- Aalto, S., Radford, S. J. E., Scoville, N. Z., & Sargent, A. I. 1997, ApJ, 475, L107 [NASA ADS] [CrossRef] [Google Scholar]
- Aalto, S., Polatidis, A. G., Hüttemeister, S., & Curran, S. J. 2002, A&A, 381, 783 [NASA ADS] [CrossRef] [EDP Sciences] [Google Scholar]
- Aalto, S., Monje, R., & Martín, S. 2007, A&A, 475, 479 [NASA ADS] [CrossRef] [EDP Sciences] [Google Scholar]
- Albrecht, M., Krügel, E., & Chini, R. 2007, A&A, 462, 575 [NASA ADS] [CrossRef] [EDP Sciences] [Google Scholar]
- Baan, W. A., Henkel, C., Loenen, A. F., Baudry, A., & Wiklind, T. 2008, A&A, 477, 747 [NASA ADS] [CrossRef] [EDP Sciences] [Google Scholar]
- Bajaja, E., Wielebinski, R., Reuter, H.-P., Harnett, J. I., & Hummel, E. 1995, A&AS, 114, 147 [Google Scholar]
- Beichman, C. A., Neugebauer, G., Habing, H. J., Clegg, P. E., & Chester, T. J., 1988, Infrared astronomical satellite (IRAS) catalogs and atlases, Explanatory supplement, 1 [Google Scholar]
- Bizyaev, D. 2001, Ap&SS, 276, 775 [NASA ADS] [CrossRef] [Google Scholar]
- Bohme, D. K., & Raksit, A. B. 1985, MNRAS, 213, 717 [NASA ADS] [Google Scholar]
- Brauher, J. R., Dale, D. A., & Helou, G. 2009, VizieR Online Data Catalog, 217, 80280 [NASA ADS] [Google Scholar]
- Bryant, P. M., & Scoville, N. Z. 1999, AJ, 117, 2632 [NASA ADS] [CrossRef] [Google Scholar]
- Casoli, F., Dupraz, C., & Combes, F. 1992, A&A, 264, 49 [NASA ADS] [Google Scholar]
- Chapman, J. F., Millar, T. J., Wardle, M., Burton, M. G., & Walsh, A. J. 2009, MNRAS, 394, 221 [NASA ADS] [CrossRef] [Google Scholar]
- Cherchneff, I., Glassgold, A. E., & Mamon, G. A. 1993, ApJ, 410, 188 [NASA ADS] [CrossRef] [Google Scholar]
- Costagliola, F., & Aalto, S. 2010, A&A, 515, A71 [NASA ADS] [CrossRef] [EDP Sciences] [Google Scholar]
- Costagliola, F., Aalto, S., Rodriguez, M. I., et al. 2011, A&A, in press [Google Scholar]
- Curran, S. J., Aalto, S., & Booth, R. S. 2000, A&AS, 141, 193 [NASA ADS] [CrossRef] [EDP Sciences] [PubMed] [Google Scholar]
- Curran, S. J., Johansson, L. E. B., Bergman, P., Heikkilä, A., & Aalto, S. 2001a, A&A, 367, 457 [NASA ADS] [CrossRef] [EDP Sciences] [Google Scholar]
- Curran, S. J., Polatidis, A. G., Aalto, S., & Booth, R. S. 2001b, A&A, 373, 459 [NASA ADS] [CrossRef] [EDP Sciences] [Google Scholar]
- Dale, D. A., Sheth, K., Helou, G., Regan, M. W., & Hüttemeister, S. 2005, AJ, 129, 2197 [NASA ADS] [CrossRef] [Google Scholar]
- Darling, J. 2007, ApJ, 669, L9 [NASA ADS] [CrossRef] [Google Scholar]
- Darling, J., & Giovanelli, R. 2002, AJ, 124, 100 [NASA ADS] [CrossRef] [Google Scholar]
- Darling, J., & Giovanelli, R. 2006, AJ, 132, 2596 [NASA ADS] [CrossRef] [Google Scholar]
- de Vicente, P., Martín-Pintado, J., Neri, R., & Colom, P. 2000, A&A, 361, 1058 [NASA ADS] [Google Scholar]
- Fukuzawa, K., & Osamura, Y. 1997, ApJ, 489, 113 [NASA ADS] [CrossRef] [Google Scholar]
- Gao, Y., & Solomon, P. M. 2004, ApJS, 152, 63 [NASA ADS] [CrossRef] [Google Scholar]
- Graciá-Carpio, J., García-Burillo, S., Planesas, P., & Colina, L. 2006, ApJ, 640, L135 [NASA ADS] [CrossRef] [Google Scholar]
- Graciá-Carpio, J., García-Burillo, S., Planesas, P., Fuente, A., & Usero, A. 2008, A&A, 479, 703 [NASA ADS] [CrossRef] [EDP Sciences] [Google Scholar]
- Heikkilä, A., Johansson, L. E. B., & Olofsson, H. 1999, A&A, 344, 817 [NASA ADS] [Google Scholar]
- Henkel, C., Schilke, P., & Mauersberger, R. 1988, A&A, 201, L23 [NASA ADS] [Google Scholar]
- Henkel, C., Menten, K. M., Murphy, M. T., et al. 2009, A&A, 500, 725 [NASA ADS] [CrossRef] [EDP Sciences] [Google Scholar]
- Hüttemeister, S., Henkel, C., Mauersberger, R., et al. 1995, A&A, 295, 571 [NASA ADS] [Google Scholar]
- Imanishi, M., Nakanishi, K., Kuno, N., & Kohno, K. 2004, AJ, 128, 2037 [NASA ADS] [CrossRef] [Google Scholar]
- Irvine, W. M., Goldsmith, P. F., & Hjalmarson, Å. 1987, in Interstellar Processes, ed. D. J. Hollenbach & H. A. Thronson, Jr., Astrophys. Space Sci. Libr., 134, 561 [Google Scholar]
- Knudsen, K. K., Walter, F., Weiss, A., et al. 2007, ApJ, 666, 156 [NASA ADS] [CrossRef] [Google Scholar]
- Koda, J., Sofue, Y., Kohno, K., et al. 2002, ApJ, 573, 105 [NASA ADS] [CrossRef] [Google Scholar]
- Kohno, K., Matsushita, S., Vila-Vilaró, B., et al. 2001, in The Central Kiloparsec of Starbursts and AGN: The La Palma Connection, ed. J. H. Knapen, J. E. Beckman, I. Shlosman, & T. J. Mahoney, ASP Conf. Ser., 249, 672 [Google Scholar]
- Krips, M., Neri, R., García-Burillo, S., et al. 2008, ApJ, 677, 262 [NASA ADS] [CrossRef] [Google Scholar]
- Lepp, S., & Dalgarno, A. 1996, A&A, 306, L21 [NASA ADS] [Google Scholar]
- Lindberg, J. 2009, Master’s thesis, Chalmers Univ. Technol., Göteborg [Google Scholar]
- Luhman, M. L., Satyapal, S., Fischer, J., et al. 2003, ApJ, 594, 758 [NASA ADS] [CrossRef] [Google Scholar]
- Malhotra, S., Kaufman, M. J., Hollenbach, D., et al. 2001, ApJ, 561, 766 [Google Scholar]
- Maloney, P. R., Hollenbach, D. J., & Tielens, A. G. G. M. 1996, ApJ, 466, 561 [NASA ADS] [CrossRef] [Google Scholar]
- Martín, S., Krips, M., Martín-Pintado, J., et al. 2011, A&A, 527, A36 [NASA ADS] [CrossRef] [EDP Sciences] [Google Scholar]
- Martín, S., Mauersberger, R., Martín-Pintado, J., Henkel, C., & García-Burillo, S. 2006, ApJS, 164, 450 [NASA ADS] [CrossRef] [Google Scholar]
- Mauersberger, R., Henkel, C., & Sage, L. J. 1990, A&A, 236, 63 [NASA ADS] [Google Scholar]
- Meier, D. S., & Turner, J. L. 2005, ApJ, 618, 259 [NASA ADS] [CrossRef] [Google Scholar]
- Meijerink, R., & Spaans, M. 2005, A&A, 436, 397 [NASA ADS] [CrossRef] [EDP Sciences] [Google Scholar]
- Meijerink, R., Spaans, M., & Israel, F. P. 2007, A&A, 461, 793 [NASA ADS] [CrossRef] [EDP Sciences] [Google Scholar]
- NED. 2009, NASA Extragalactic Database [Google Scholar]
- Negishi, T., Onaka, T., Chan, K., & Roellig, T. L. 2001, A&A, 375, 566 [NASA ADS] [CrossRef] [EDP Sciences] [Google Scholar]
- Nguyen-Q-Rieu,Nakai, N., & Jackson, J. M. 1989, A&A, 220, 57 [NASA ADS] [Google Scholar]
- Nguyen-Rieu, Viallefond, F., Combes, F., et al. 1994, in Astronomy with Millimeter and Submillimeter Wave Interferometry, ed. M. Ishiguro & J. Welch, ASP Conf. Ser., 59, IAU Colloq. 140, 336 [Google Scholar]
- Papadopoulos, P. P. 2007, ApJ, 656, 792 [NASA ADS] [CrossRef] [Google Scholar]
- Pérez-Beaupuits, J. P., Aalto, S., & Gerebro, H. 2007, A&A, 476, 177 [NASA ADS] [CrossRef] [EDP Sciences] [Google Scholar]
- Prasad, S. S., & Huntress, Jr., W. T. 1980, ApJ, 239, 151 [NASA ADS] [CrossRef] [Google Scholar]
- Regan, M. W., Sheth, K., & Vogel, S. N. 1999, ApJ, 526, 97 [NASA ADS] [CrossRef] [Google Scholar]
- Rodriguez-Franco, A., Martin-Pintado, J., & Fuente, A. 1998, A&A, 329, 1097 [NASA ADS] [Google Scholar]
- Sakai, N., Sakai, T., Hirota, T., & Yamamoto, S. 2008, ApJ, 672, 371 [NASA ADS] [CrossRef] [Google Scholar]
- Sakai, N., Sakai, T., Hirota, T., Burton, M., & Yamamoto, S. 2009, ApJ, 697, 769 [NASA ADS] [CrossRef] [Google Scholar]
- Sanders, D. B., Mazzarella, J. M., Kim, D.-C., Surace, J. A., & Soifer, B. T. 2003, AJ, 126, 1607 [Google Scholar]
- Schilke, P., Walmsley, C. M., Pineau Des Forets, G., et al. 1992, A&A, 256, 595 [NASA ADS] [Google Scholar]
- Solomon, P. M., Downes, D., Radford, S. J. E., & Barrett, J. W. 1997, ApJ, 478, 144 [NASA ADS] [CrossRef] [Google Scholar]
- Sorai, K., Nakai, N., Kuno, N., & Nishiyama, K. 2002, PASJ, 54, 179 [NASA ADS] [Google Scholar]
- Spoon, H. W. W., Keane, J. V., Tielens, A. G. G. M., et al. 2002, A&A, 385, 1022 [NASA ADS] [CrossRef] [EDP Sciences] [Google Scholar]
- Spoon, H. W. W., Marshall, J. A., Houck, J. R., et al. 2007, ApJ, 654, L49 [NASA ADS] [CrossRef] [Google Scholar]
- Stacey, G. J., Geis, N., Genzel, R., et al. 1991, ApJ, 373, 423 [NASA ADS] [CrossRef] [Google Scholar]
- Szczepanski, J., Wang, H., Doughty, B., Cole, J., & Vala, M. 2005, ApJ, 626, L69 [NASA ADS] [CrossRef] [Google Scholar]
- Tielens, A. G. G. M., & Hollenbach, D. 1985, ApJ, 291, 722 [NASA ADS] [CrossRef] [Google Scholar]
- Wang, M., Henkel, C., Chin, Y.-N., et al. 2004, A&A, 422, 883 [NASA ADS] [CrossRef] [EDP Sciences] [Google Scholar]
All Tables
List of investigated objects and some of their properties. For the galaxies with new observations reported, the given positions are those used for our observations. For objects not observed by us the position in NED (2009) is given.
All Figures
|
Fig. 1 HC3N 10-9 spectra for Arp 220, IRAS 17208-0014 (detections), NGC 2146 (non-detection), NGC 3079 (detection), and UGC 5101 (non-detection). For Arp 220 and IRAS 17208-0014, part of the HNC 1-0 line is also visible. Some of the reported HC3N 10-9-detections are found in the HNC 1-0 spectra, see Fig. 7. |
| In the text | |
|
Fig. 2 HC3N 12-11 spectra for Arp 220 (detection), IC 694 (non-detection), Maffei 2 (detection), NGC 2146, NGC 2623, NGC 3690, and NGC 6946 (non-detections). |
| In the text | |
|
Fig. 3 HC3N 16-15 spectra for NGC 1056, NGC 1377, and NGC 3079 (non-detections). The absorption-like features in the NGC 1056 spectrum are most likely due to a problem with the backend of the receiver. |
| In the text | |
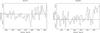 |
Fig. 4 HC3N 25-24 spectra for NGC 1377 and NGC 3079 (non-detections). |
| In the text | |
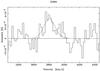 |
Fig. 5 HC3N 28-27 spectrum for IC 860 (detection). |
| In the text | |
 |
Fig. 6 HCN 1-0 spectra for NGC 613 (non-detection), NGC 1377, and NGC 4418 (detections). |
| In the text | |
|
Fig. 7 HNC 1-0 spectra for Circinus, IC 860, IRAS 17208-0014 (detections), NGC 34, NGC 613, NGC 1056, NGC 1377, NGC 1614 (non-detections), NGC 4945 (detection), NGC 5135, and UGC 5101 (non-detections). For Circinus, the HC3N 10-9 line is also visible. Bandwidths for the spectra of NGC 34, NGC 613, NGC 1614, and NGC 5135 are broad enough to include non-detections of the HC3N 10-9 line, thus giving upper limits for these lines. |
| In the text | |
|
Fig. 8 Tentative correlation between HC3N/HCN ratio and silicate absorption strength. The HC3N/HCN values for IC 342, NGC 253, and M82 are probably overestimated (indicated by thinner error bars, see Appendix A.1). The objects for which the HC3N 12-11 line has been used instead of the HC3N 10-9 line when calculating the HC3N/HCN ratio are indicated by a star. The silicate absorption strength is in a magnitude scale: A higher negative number means stronger silicate absorption. |
| In the text | |
|
Fig. 9 Histogram over number of galaxies in normalised OH megamaser luminosity. Light-grey corresponds to galaxies considered HC3N-poor, medium-gray corresponds to nearby HC3N-luminous galaxies whose HC3N/HCN ratios probably are overestimated (see Appendix A.1), dark-grey corresponds to all other HC3N-luminous galaxies, and white corresponds to galaxies where the upper limit on the HC3N/HCN ratio is too high to tell whether it is HC3N-luminous or not. The galaxies for which OH maser emission is non-detected in Darling & Giovanelli (2002) and/or Darling (2007) are stacked in the leftmost column of the histogram. |
| In the text | |
|
Fig. 10 Histogram over number of galaxies in IRAS 60 μm/100 μm flux density ratio. Light-grey corresponds to galaxies considered HC3N-poor, medium-gray corresponds to nearby HC3N-luminous galaxies whose HC3N/HCN ratios probably are overestimated (see Appendix A.1), dark-grey corresponds to all other HC3N-luminous galaxies, and white corresponds to galaxies where the upper limit on the HC3N/HCN ratio is too high to tell whether it is HC3N-luminous or not. IRAS 60 μm/100 μm flux density values are all from Sanders et al. (2003), except for Circinus and Maffei 2, which are from Beichman et al. (1988). |
| In the text | |
|
Fig. 11 Histogram over number of galaxies in C ii flux normalised by FIR flux. Light-grey corresponds to galaxies considered HC3N-poor, medium-gray corresponds to nearby HC3N-luminous galaxies whose HC3N/HCN ratios probably are overestimated (see Appendix A.1), dark-grey corresponds to all other HC3N-luminous galaxies, and white corresponds to galaxies where the upper limit on the HC3N/HCN ratio is too high to tell whether it is HC3N-luminous or not. FIR fluxes were calculated from IRAS 60 μm and 100 μm fluxes with the method described in Bizyaev (2001). The references for the used IRAS fluxes are given in the caption of Fig. 10. C ii flux values are from Negishi et al. (2001), except for IC 342 and NGC 3079 (Stacey et al. 1991); IC 860 and NGC 4418 (Malhotra et al. 2001); Arp 220 (Luhman et al. 2003); and NGC 1614 (Brauher et al. 2009). |
| In the text | |
|
Fig. 12 log-log plot of the HC3N/HCN line ratio versus the HNC/HCN line ratio. The HC3N/HCN values for IC 342, Maffei 2, M82, and NGC 253 are probably overestimated (indicated by thin error bars, see Appendix A.1). The objects for which the HC3N 12-11 line has been used instead of the HC3N 10-9 line when calculating the HC3N/HCN ratio are indicated by a star. |
| In the text | |
Current usage metrics show cumulative count of Article Views (full-text article views including HTML views, PDF and ePub downloads, according to the available data) and Abstracts Views on Vision4Press platform.
Data correspond to usage on the plateform after 2015. The current usage metrics is available 48-96 hours after online publication and is updated daily on week days.
Initial download of the metrics may take a while.