Fig. 11
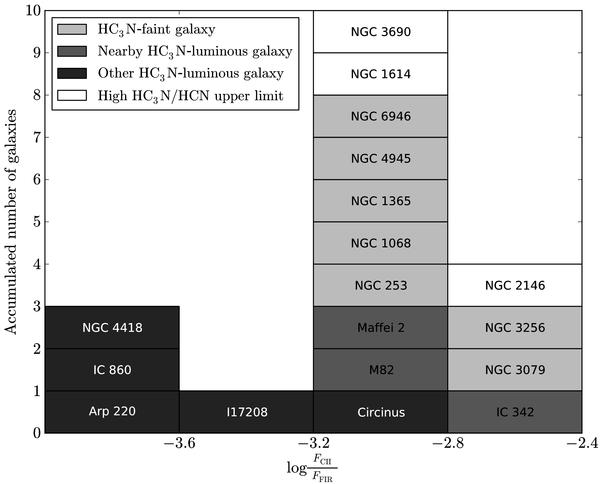
Histogram over number of galaxies in C ii flux normalised by FIR flux. Light-grey corresponds to galaxies considered HC3N-poor, medium-gray corresponds to nearby HC3N-luminous galaxies whose HC3N/HCN ratios probably are overestimated (see Appendix A.1), dark-grey corresponds to all other HC3N-luminous galaxies, and white corresponds to galaxies where the upper limit on the HC3N/HCN ratio is too high to tell whether it is HC3N-luminous or not. FIR fluxes were calculated from IRAS 60 μm and 100 μm fluxes with the method described in Bizyaev (2001). The references for the used IRAS fluxes are given in the caption of Fig. 10. C ii flux values are from Negishi et al. (2001), except for IC 342 and NGC 3079 (Stacey et al. 1991); IC 860 and NGC 4418 (Malhotra et al. 2001); Arp 220 (Luhman et al. 2003); and NGC 1614 (Brauher et al. 2009).
Current usage metrics show cumulative count of Article Views (full-text article views including HTML views, PDF and ePub downloads, according to the available data) and Abstracts Views on Vision4Press platform.
Data correspond to usage on the plateform after 2015. The current usage metrics is available 48-96 hours after online publication and is updated daily on week days.
Initial download of the metrics may take a while.