| Issue |
A&A
Volume 527, March 2011
|
|
|---|---|---|
| Article Number | A76 | |
| Number of page(s) | 11 | |
| Section | Extragalactic astronomy | |
| DOI | https://doi.org/10.1051/0004-6361/201015283 | |
| Published online | 28 January 2011 | |
THINGS about MOND
1
Sterrenkundig Observatorium, Universiteit Gent,
Krijgslaan 281,
9000
Gent,
Belgium
e-mail: This email address is being protected from spambots. You need JavaScript enabled to view it.
2
Observatoire Astronomique, Université de Strasbourg, CNRS UMR
7550, 67000
Strasbourg,
France
3
AIfA, Universtät Bonn, 53121
Bonn,
Germany
4
Department of Astronomy, University of Cape Town,
Private Bag X3, Rondebosch
7701, South
Africa
Received:
25
June
2010
Accepted:
5
November
2010
Abstract
We present an analysis of 12 high-resolution galactic rotation curves from The HI Nearby Galaxy Survey (THINGS) in the context of modified Newtonian dynamics (MOND). These rotation curves were selected to be the most reliable for mass modelling, and they are the highest quality rotation curves currently available for a sample of galaxies spanning a wide range of luminosities. We fit the rotation curves with the “simple” and “standard” interpolating functions of MOND, and we find that the “simple” function yields better results. We also redetermine the value of a0, and find a median value very close to the one determined in previous studies, a0 = (1.22 ± 0.33) × 10-8 cm s-2. Leaving the distance as a free parameter within the uncertainty of its best independently determined value leads to excellent quality fits for 75% of the sample. Among the three exceptions, two are also known to give relatively poor fits in Newtonian dynamics plus dark matter. The remaining case (NGC 3198) presents some tension between the observations and the MOND fit, which might, however, be explained by the presence of non-circular motions, by a small distance, or by a value of a0 at the lower end of our best-fit interval, 0.9 × 10⁻⁸ cm s-2. The best-fit stellar M/L ratios are generally in remarkable agreement with the predictions of stellar population synthesis models. We also show that the narrow range of gravitational accelerations found to be generated by dark matter in galaxies is consistent with the narrow range of additional gravity predicted by MOND.
Key words: galaxies: kinematics and dynamics / dark matter / galaxies: spiral / gravitation
© ESO, 2011
1. Introduction
The current dominant paradigm is that galaxies are embedded in haloes of cold dark matter (CDM), made of non-baryonic weakly-interacting massive particles (e.g., Bertone et al. 2005). However, an alternative way to explain the observed rotation curves of galaxies is the postulate of Milgrom (1983) that for gravitational accelerations below a certain value a0, the true gravitational attraction g approaches (gNa0)1/2 where gN is the usual Newtonian gravitational field (as calculated from the observed distribution of visible matter). This paradigm is known as modified Newtonian dynamics (MOND).
MOND successfully explains many phenomena in galaxies, among which the following non-exhaustive list. (i) It predicted the shape of rotation curves of low surface-brightness (LSB) galaxies before any of them had ever been measured (e.g. McGaugh & de Blok 1998). (ii) Tidal dwarf galaxies (TDG), which should be devoid of collisionless dark matter, still exhibit a mass-discrepancy in Newtonian dynamics, which is perfectly explained by MOND (Gentile et al. 2007). (iii) The baryonic Tully-Fisher relation (e.g., McGaugh 2005), one of the tightest observed relations in astrophysics, is a natural consequence of MOND, both for its slope and its zero-point. (iv) The first realistic simulations of galaxy merging in MOND were recently carried out, notably reproducing the morphology of the Antennae galaxies (Tiret & Combes 2008). (v) It naturally explains the universality of “dark” and baryonic surface densities within one core radius in galaxies (Donato et al. 2009; Gentile et al. 2009).
Recent theoretical developments have also added plausibility to the case for MOND through the work of, e.g., Bekenstein (2004), Sanders (2005), Zlosnik et al. (2007), Halle et al. (2008), and Blanchet & Le Tiec (2008), who have all presented Lorentz-covariant theories yielding a MOND behaviour in the weak field limit. Although still fine-tuned and far from a fundamental theory explaining the MOND paradigm, these effective theories remarkably allow for new predictions regarding cosmology (e.g., Skordis et al. 2006) and gravitational lensing (e.g., Angus et al. 2007; Shan et al. 2008). For reviews of MOND’s successes and weaknesses, both at the observational and theoretical levels, as well as comparisons with dark matter results, see McGaugh & de Blok (1998), de Blok & McGaugh (1998), Sanders & McGaugh (2002), Bruneton & Esposito-Farèse (2008), Milgrom (2008), Skordis (2009), Famaey & Bruneton (2009), Ferreira & Starkman (2009).
One thing the MOND paradigm does not directly predict, though, is the shape of the interpolation between the MONDian regime where g ≪ a0 and the Newtonian regime where g ≫ a0, as well as the actual value of the acceleration constant a0. The last is in principle a free parameter, but once its value has been determined by some means, it must be identical for every astronomical object. Large variations of a0 would invalidate MOND as a fundamental paradigm underpinned by new physics. As shown in Begeman et al. (1991) fits with variable a0 and fixed distance D are essentially identical to fits with fixed a0 and variable D because the observed total gravitational acceleration is proportional to 1/D. Ideally, the fitted distance should, however, generally conform to the independently determined one (e.g., Cepheids-based or RGB tip-based). Finally, a consequence of the absence of galactic dark matter within the MOND context is that the dynamical mass-to-light ratio that is derived from a rotation curve fit should agree with the true stellar mass-to-light ratio of the stellar disk (and sometimes bulge), as inferred from e.g. observed colours and stellar population synthesis models.
Here, we use results from The HI Nearby Galaxy Survey (THINGS; Walter et al. 2008), which consists of high-resolution HI observations of a sample of 34 nearby galaxies, in order to constrain the transition function of MOND. In particular, we show that some individual galaxies that had been claimed to be potentially problematic for MOND, such as NGC 2841 (Begeman et al. 1991), can yield good fits with the “simple” interpolating function.
We use a subset of the THINGS galaxies for which rotation curves could be derived in de Blok et al. (2008), restricting ourselves to galaxies that are not (obviously) dominated by non-circular motions. In Sect. 2, we summarize the popular choices that have been proposed in the literature for the transition between the MONDian and Newtonian regimes, in order to confront these different transitions with THINGS rotation curves. In Sect. 3, we explain how we selected the subsample of galaxies that we model in the context of MOND. Section 4.1. then presents the results for the value of the acceleration constant a0, while Sects. 4.2 and 4.3 present the comparison of the rotation curve fits for the different transitions, especially the best-fit mass-to-light ratios and distances. Finally, in Sect. 4.4, we discuss NGC 3198, the only case where the MOND fits perform significantly worse than dark matter fits in the context of Newtonian dynamics. Conclusions are drawn in Sect. 5.
2. MOND and its interpolating function
The MOND paradigm stipulates that the Newtonian acceleration
gN produced by the visible matter is linked to
the true gravitational acceleration g by means of an
interpolating function μ:  (1)where
μ(x) ~ x for
x ≪ 1 and μ(x) ~ 1 for
x ≫ 1 (and g = | g | ).
However, this expression cannot be exact for all orbits and all geometries, since it does
not respect the usual conservation laws. Such a modification of Newtonian dynamics could
come at the classical (non-covariant) level from a modification of either the kinetic or the
gravitational part of the Newtonian action (with the usual notations, and
φN is the Newtonian gravitational potential):
(1)where
μ(x) ~ x for
x ≪ 1 and μ(x) ~ 1 for
x ≫ 1 (and g = | g | ).
However, this expression cannot be exact for all orbits and all geometries, since it does
not respect the usual conservation laws. Such a modification of Newtonian dynamics could
come at the classical (non-covariant) level from a modification of either the kinetic or the
gravitational part of the Newtonian action (with the usual notations, and
φN is the Newtonian gravitational potential):
 (2)where modifying the first
term is referred to as modified inertia and modifying the second term as
modified gravity. Milgrom (1994)
has shown that within the modified inertia framework, Eq. (1) was exact only
for circular orbits. For other orbits, predictions are difficult to make since the
theory is non-local. On the other hand, Bekenstein & Milgrom (1984) have shown that within a modified gravity framework where
|∇φN| 2 is replaced by
(2)where modifying the first
term is referred to as modified inertia and modifying the second term as
modified gravity. Milgrom (1994)
has shown that within the modified inertia framework, Eq. (1) was exact only
for circular orbits. For other orbits, predictions are difficult to make since the
theory is non-local. On the other hand, Bekenstein & Milgrom (1984) have shown that within a modified gravity framework where
|∇φN| 2 is replaced by
 in Eq. (2) (φ
being the MONDian potential and F′ = μ), the right-hand
side of Eq. (1) had to be replaced by
gN + s where
s is a solenoidal vector field determined by the condition
that g can be expressed as the gradient of a MONDian
potential. Milgrom (2010) proposes another modified
gravity formulation in which |∇φN| 2 is replaced
by
in Eq. (2) (φ
being the MONDian potential and F′ = μ), the right-hand
side of Eq. (1) had to be replaced by
gN + s where
s is a solenoidal vector field determined by the condition
that g can be expressed as the gradient of a MONDian
potential. Milgrom (2010) proposes another modified
gravity formulation in which |∇φN| 2 is replaced
by  (with φ the
MOND potential, φN remaining the Newtonian one, and
1/Q′ = μ). In this case, the solenoidal field to be
added to the right-hand side of Eq. (1) is different from the one in the Bekenstein
& Milgrom formulation (see also Zhao & Famaey 2010).
(with φ the
MOND potential, φN remaining the Newtonian one, and
1/Q′ = μ). In this case, the solenoidal field to be
added to the right-hand side of Eq. (1) is different from the one in the Bekenstein
& Milgrom formulation (see also Zhao & Famaey 2010).
Although Brada & Milgrom (1995), Famaey et al. (2007) and Zhao & Famaey (2010) have shown that the expected differences in the predictions of the various formulations for rotation curves are not very large, they can be of the same order of magnitude as the differences produced by different choices for the μ-function. To constrain μ within the modified gravity framework, one should calculate predictions of the modified Poisson formulations of Bekenstein & Milgrom (1984) or Milgrom (2010) numerically for each galaxy model and for each choice of parameters. This is left for later works and we chose to concentrate here on the modified inertia formulation for circular orbits given by Eq. (1).
It is worth noting that other interesting constraints on MOND and its μ-function could come either from studies of the effect of the galactic gravitational field on the dynamics of the inner Solar System (Milgrom 2009) or from studies of the dynamics perpendicular to the galactic disk at the solar position (Bienaymé et al. 2009).
Various choices for the shape of the μ-function have been proposed (see
especially Milgrom & Sanders 2008; and
McGaugh 2008), but we concentrate here on the two
most popular choices studied so far. The “standard” μ-function
(Milgrom 1983) yields a relatively sharp transition
from the MONDian (x ≪ 1, where
x = g/a0 and
g is the gravitational acceleration) to the Newtonian
(x ≫ 1) regime:  (3)The “simple”
μ-function (Famaey & Binney 2005; Zhao & Famaey 2006) yields a
more gradual transition:
(3)The “simple”
μ-function (Famaey & Binney 2005; Zhao & Famaey 2006) yields a
more gradual transition:  (4)Figure 1 displays those two μ-functions as a
function of x. We note that the simple function predicts that a constant
acceleration equal to a0 has to be added to the Newtonian
gravitational acceleration for g ≫ a0. For the
values of a0 compatible with galaxy rotation curves (Sect. 4.1),
this strongly disagrees with orbits of planets in the inner Solar System, and especially
with measures of the perihelion precession of Mercury. A solution is to use an “improved
simple” μ-function that rapidly interpolates between the simple and
standard ones for values of the gravitational acceleration
g ≳ 10a0 (i.e. a higher value than those
g that are probed by galaxy rotation curves). Such an improved simple
function is shown as an example in Fig. 1.
Nevertheless, we use the standard and simple μ-functions hereafter (keeping
in mind that the latter should be modified in the strong gravity regime) of Eqs. (3) and (4)
in order to perform our MOND fits to THINGS galaxy rotation curves.
(4)Figure 1 displays those two μ-functions as a
function of x. We note that the simple function predicts that a constant
acceleration equal to a0 has to be added to the Newtonian
gravitational acceleration for g ≫ a0. For the
values of a0 compatible with galaxy rotation curves (Sect. 4.1),
this strongly disagrees with orbits of planets in the inner Solar System, and especially
with measures of the perihelion precession of Mercury. A solution is to use an “improved
simple” μ-function that rapidly interpolates between the simple and
standard ones for values of the gravitational acceleration
g ≳ 10a0 (i.e. a higher value than those
g that are probed by galaxy rotation curves). Such an improved simple
function is shown as an example in Fig. 1.
Nevertheless, we use the standard and simple μ-functions hereafter (keeping
in mind that the latter should be modified in the strong gravity regime) of Eqs. (3) and (4)
in order to perform our MOND fits to THINGS galaxy rotation curves.
 |
Fig. 1 The interpolating μ-functions of Eq. (3) (standard, dashed line) and Eq. (4) (simple, dotted line) are displayed as a function of x = g/a0. An improved simple function (solid line) interpolating between simple and standard for x ≳ 10 is also presented to show that a transition behaviour governed by the simple μ-function in galaxies (where x < 10) can a priori be in accordance with the Solar System constraints (where x ≫ 10). |
3. The sample
We use a subset of galaxies in the THINGS survey for which rotation curves were derived in de Blok et al. (2008). We restrict ourselves to galaxies that are not (obviously) dominated by non-circular motions. This means we omit the bright disk galaxies NGC 3031 and NGC 4736. While not necessarily dominated by non-circular motions, we also omit NGC 2366, IC 2574, and NGC 925. These galaxies have a neutral gas distribution that is dominated by holes and shells, the signature of which remains visible in the radial profile of the neutral gas. In these dwarf galaxies, the neutral gas profile dominates the total radial baryonic mass distribution, and because the MOND prediction is derived from the observed radial surface density distribution these remaining signatures of the holes and shells could possibly lead to erroneous results. The analysis of these specific rotation curves, interesting as they might be, is left to a forthcoming paper.
This leaves us with a total of 12 galaxies. Some of these have already been discussed in Bottema et al. (2002), but with the higher resolution data available, and constrained stellar mass-to-light ratios as observed in the Spitzer IRAC 3.6 μm band, we are able to perform a slightly more stringent test for MOND. In fact, the 12 rotation curves that we use here are the highest quality rotation curves currently available (in terms of spatial/spectral resolution and extent) for a sizeable sample of galaxies spanning a wide range of luminosities, so they represent an important test for MOND or any theory that aims at fitting galaxy kinematics. In de Blok et al. (2008) some differences between their rotation curves and those of previous publications were highlighted. These differences could be caused by the different approach taken by de Blok et al. (2008) to derive the velocity field. They fit the velocity profiles using third-order Gauss-Hermite polynomials, instead of the more conventional intensity-weighted mean.
The two baryonic contributions to the rotation curve, needed to compute the MOND mass model, were derived by de Blok et al. (2008) as follows. First, the shape (but not the amplitude) of Vstars, the contribution of the stars to the rotation curve, was derived from the observed 3.6 μm surface brightness profile, and slightly modified to account for the observed (J − K) colour gradients as a function of radius (which indicate a radially varying stellar mass-to-light M/L ratio). Although there might be some contamination from young stars and hot dust, this contamination is thought to be a negligible contribution to the flux at 3.6 μm, see e.g. Pahre et al. (2004), Li et al. (2007), hence the 3.6 μm emission is considered as good a tracer of stellar mass as the more commonly used K-band (Zhu et al. 2010). For the vertical distribution of the stellar disk, de Blok et al. (2008) assumed a sech2 distribution with a scale height of z0 = h/5, where h is the radial exponential scale length. The amplitude of Vstars is scaled according to the global stellar mass-to-light M/L ratio, which is left as a free parameter and then compared to the predictions of stellar population synthesis models (e.g. Bell & de Jong 2001). The contribution of the gaseous disk to the rotation curve, Vgas, was derived from the observed HI surface density profiles, and then corrected for primordial He.
The galaxy distances are determined by various methods (Cepheids, tip of the red giant branch, Hubble flow, brightest stars), and their quoted uncertainties are often close to 10%. They are listed in Table 1.
Galaxy distances and the methods used to determine them.
4. Results
4.1. The acceleration constant a0
The acceleration constant a0 of MOND, although unknown from first principles, must be the same for all galaxies, therefore it has to be determined empirically, e.g. by fitting rotation curves. Begeman et al. (1991) determined the value of the acceleration constant a0 to be 1.21 × 10⁻⁸ cm s-2 from mass modelling of a number of nearby galaxies with the standard μ-function of Eq. (3). This value was confirmed by Sanders & Verheijen (1998) using a sample of rotation curves of galaxies belonging to the Ursa Major galaxy group. However, Bottema et al. (2002) note that using an updated value of the distance to the Ursa Major group would bring the value of a0 down to 0.9 × 10⁻⁸ cm s-2.
The first fits that we performed were those with a0 as a free parameter (and stellar M/L ratio is the other free parameter). The distance in these fits was fixed at the values given in Table 1, the most accurate for each galaxy to date, to the best of our knowledge. NGC 2403 is the only galaxy whose distance differs from Walter et al. (2008). We used the estimate of the distance given in Vinkó et al. (2006) because it comes from more numerous and more recent data. We remind the reader that a fit with a0 free and the distance fixed is equivalent to a fit with the distance free and a0 fixed (Begeman et al. 1991), because the observed total gravitational acceleration is proportional to 1/D, where D is the distance.
 |
Fig. 2 Best-fit a0 values (using the simple interpolating function) vs. central surface brightness in the 3.6 μm band. |
Swaters et al. (2010) find a weak correlation between the R-band central surface brightness and the best-fit value of a0 as a result of making MOND mass models of 27 dwarf and low surface brightness galaxies. They find that lower surface brightness galaxies have a tendency to have lower a0. In Fig. 2 we look for a similar relation using our best-fit values of a0 from the MOND fits using the simple μ-function. We do not find the same correlation: indeed, the best-fit values of a0 are scattered around the median value without any obvious correlation with central surface brightness. A thorough interpretation of the correlation (or lack thereof) between best-fit a0 and central surface brightness goes beyond the aim of this paper, but our finding might not invalidate the interpretation by Swaters et al. (2010) that low surface brightness galaxies could be biased towards lower values of a0 because of the external field effect (e.g. Milgrom 1983). In our sample, apart from DDO 154, the galaxies have a relatively high surface brightness.
The result is that the median values are (1.27 ± 0.30) × 10-8 cm
s-2 for the standard μ function (Eq. (3)) and (1.22 ± 0.33) × 10-8 cm
s-2 for the simple μ function (Eq. (4)), values that are remarkably similar to the
estimates made in previous studies (uncertainties were calculated following Müller 2000). However, for consistency we now use these new
values in the remainder of the paper. We note that our estimates of
a0 lie between
cH0/(2π) ≈ 1.1 × 10⁻⁸ cm s-2
(where H0 is the Hubble constant) and
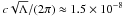 cm s-2
(where Λ is the cosmological constant). However, the estimate of
a0 given by Bottema et al. (2002), 0.9 × 10⁻⁸ cm s-2, cannot be excluded by the
present data, see Sect. 4.3.
cm s-2
(where Λ is the cosmological constant). However, the estimate of
a0 given by Bottema et al. (2002), 0.9 × 10⁻⁸ cm s-2, cannot be excluded by the
present data, see Sect. 4.3.
4.2. Mass-to-light ratios
Starting from fixed distances to the 12 galaxies, we found in Sect. 4.1 a common median value of a0
corresponding to each interpolating μ-function. Using this we perform 6
different types of fits to each galaxy rotation curve. For each of the two
μ-functions, we make fits with a fixed value of
a0 and (i) a fixed distance, (ii) a distance constrained to
lie within the error bars from its independent determination, and (iii) a free distance
with no constraints. In all cases, the stellar mass-to-light ratio of the disk (and bulge
if present) is left as a free parameter. All the results are listed in Table 2, where
M/Ldisk and
M/Lbulge are in the
3.6 μm band. The values called f are the ratio between
the best-fit value and the “nominal” one (stellar M/L
from the colours and the independently determined distance). The distance is in Mpc and
 is the reduced
χ2 (this number is useful to compare different models of the
same galaxy but should not be used as a true probability indicator, see footnote 1). The values refer to the fits made with
a0 = 1.22 × 10⁻⁸ cm s-2.
is the reduced
χ2 (this number is useful to compare different models of the
same galaxy but should not be used as a true probability indicator, see footnote 1). The values refer to the fits made with
a0 = 1.22 × 10⁻⁸ cm s-2.
From the χ2 values1, the lack of systematic deviations and the small number of highly discrepant data points, one can conclude that the fits are generally good, with only a few exceptions (cf. next section). However, one has to check that, when a bulge is present, the mass-to-light ratio of the disk is lower than that of the bulge, and that the stellar M/L ratios are realistic.
There are five galaxies with a bulge. Using the standard μ function, two galaxies have a best-fit stellar M/L of the disk that is higher than the one of the bulge. Of the remaining three cases, one is undetermined (NGC 2903: its best-fit M/L of the bulge is zero but values higher than the best-fit M/L of the disk give almost equally good fits; note also the likely presence of a bar, Leroy et al. 2009), and two are realistic, i.e. the M/L of the disk is smaller than M/L of the bulge. On the other hand, when using the simple μ function no such problems arise, and the M/L of the bulge is always realistic. We therefore, in line with Sanders & Noordermeer (2007), conclude that the simple μ function gives superior fits. For the rest of the paper we thus only use the simple μ function. This justifies our proposal in Fig. 1 of a μ function that resembles the simple one at typical galactic gravitational accelerations (and the standard one for higher accelerations representative of, e.g, the Solar System).
To check how realistic the fitted stellar M/L ratios
are, we compared them with the results of stellar population synthesis models. In
Fig. 3 we plot the best-fit “global”
M/L ratios in the 3.6 μm band vs.
(J − K):
 (5)These
M/L are compared to the population synthesis models
predictions (from Bell & de Jong 2001; using
also Eq. (4) of de Blok et al. 2008) with a
“diet-Salpeter” IMF. Although with some scatter, the points lie close to the prediction,
and the M/L ratios in the 3.6 μm band
vary very gradually with colour, staying constant around 0.5–1. It is also interesting to
compare our results in a band where the predicted stellar
M/L varies more rapidly with colour. To achieve
this, we converted our M/L ratios to
B-band (using the B-band luminosity given in de Blok
et al. 2008), and we made use of the corrected
(B − V) colours given in the HyperLeda database
(Paturel et al. 2003). For NGC 7793, the corrected
(B − V) colour was not available and we used the
effective one. The results are shown in Fig. 4. The
best-fit stellar M/L of MOND closely follows the
predictions of Bell & de Jong (2001), in
that redder galaxies are best fitted with a higher stellar
M/L ratio.
(5)These
M/L are compared to the population synthesis models
predictions (from Bell & de Jong 2001; using
also Eq. (4) of de Blok et al. 2008) with a
“diet-Salpeter” IMF. Although with some scatter, the points lie close to the prediction,
and the M/L ratios in the 3.6 μm band
vary very gradually with colour, staying constant around 0.5–1. It is also interesting to
compare our results in a band where the predicted stellar
M/L varies more rapidly with colour. To achieve
this, we converted our M/L ratios to
B-band (using the B-band luminosity given in de Blok
et al. 2008), and we made use of the corrected
(B − V) colours given in the HyperLeda database
(Paturel et al. 2003). For NGC 7793, the corrected
(B − V) colour was not available and we used the
effective one. The results are shown in Fig. 4. The
best-fit stellar M/L of MOND closely follows the
predictions of Bell & de Jong (2001), in
that redder galaxies are best fitted with a higher stellar
M/L ratio.
 |
Fig. 3 Stellar M/L ratio in the 3.6 μm band vs. (J − K) colour. The full circles are the results of the MOND fits (using the simple μ-function of Eq. (4) and a0 = 1.22 × 10⁻⁸ cm s-2) with the distance constrained within the uncertainties of its independently determined value, whereas the solid line represents the predictions of stellar population synthesis models (see text for details). |
 |
Fig. 4 Stellar M/L ratio in the B band vs. (B − V) colour. See Fig. 3 for the explanation of line and symbols. |
The only three galaxies where the best-fit disk M/L ratio differs from the population synthesis one by more than a factor of two are NGC 2903, NGC 2976, and NGC 7331 (see Fig. 3 and Table 2). In NGC 2903 the MOND fit significantly overpredicts the M/L, a phenomenon that was also observed in Newtonian mass models with dark matter (de Blok et al. 2008). If one followed population synthesis predictions, the predicted stellar disk would be surprisingly very sub-maximum for a massive galaxy with a rapidly increasing rotation curve with maximum velocity ~215 km s-1. In addition, in the central parts of NGC 2903 there is evidence of a bar (e.g. Leroy et al. 2009): the non-circular motions associated to it further increase the uncertainties on the mass modelling results (see also Sellwood & Zánmar Sánchez 2010). For NGC 2976, on the other hand, the MOND fits underpredict the stellar M/L ratio, but again this is also observed in the Newtonian mass models with dark matter. In addition, having a stellar disk that strongly dominates the kinematics over most of the extent of the gaseous disk in a galaxy with maximum velocity ~85 km s-1 would also be surprising. Mass model degeneracies in this galaxy (in particular the MOND mass models with distance free and distance constrained) are complicated by the very similar shapes of Vstars and Vgas. In NGC 2976 too, Leroy et al. (2009) find an indication of a weak bar. Also in NGC 7331 the MOND fits give a lower M/L compared to the expectations from the colours. This is the case also in the dark matter fits. Indeed, see de Blok et al. (2008) where a strong dust ring is suggested as a possible explanation of the inflated stellar M/L ratios predicted from the colours.
4.3. Distances
One then also has to check that the fits with the distances constrained to lie within the error bars from their independent determinations are of good quality. When this is not the case, it means that MOND would predict another distance than what has been measured to date. NGC 2841 is, e.g., the best known and most persistently problematic galaxy for MOND. Begeman et al. (1991) have pointed out that a good MOND fit could only be obtained if the galaxy was a factor ~2 farther away than the Hubble distance of ~9.5 Mpc. This large discrepancy was alleviated somewhat when HST Cepheids measurements suggested a distance of 14.1 Mpc (Macri et al. 2001), but the discrepancy remained. However, these fits were performed with the standard μ-function (Eq. (3)) and not the simple one (Eq. (4)). Our fits here show that the problem of the distance is solved when using the simple μ-function (see the reduced χ2 in Table 2) and that the stellar mass-to-light ratio is also in accordance with population synthesis models.
All the fits of the 12 high-quality rotation curves, using the simple μ-function of Eq. (4), a0 = 1.22 × 10⁻⁸ cm s-2 and a distance lying within the error bars coming from an independent distance determination, are shown in Fig. 5. The fits are clearly very good for 9 galaxies (including NGC 3521, whose high reduced χ2 value in Table 2 is dominated by the innermost two points, which have highly uncertain position angle and inclination, see de Blok et al. 2008). Among the galaxies with the 3 least good fits (NGC 3198, NGC 7793, and NGC 2976), we do not discuss NGC 7793 and NGC 2976 further, since the MOND fits present the same failures as the dark matter fits (in Newtonian dynamics), therefore we do not consider them as evidence against MOND. We just briefly note that in NGC 7793 the value of the inclination angle fitted by de Blok et al. (2008) is low and presents large variations in adjacent radii, which results in a poorly constrained rotation curve. In NGC 2976 the amplitude of the non-circular motions (Trachternach et al. 2008) is correlated with the amplitude of the fit residuals.
 |
Fig. 5 Rotation curve fits with the distance “constrained” and a0 = 1.22 × 10⁻⁸ (μ simple d constr. in Table 2). Dashed, dotted, and long-dashed lines represent the Newtonian contributions of the gaseous disk, stellar disk, and bulge, respectively. The MOND best-fit model is shown as a solid red line. |
Before proceeding with a detailed analysis of possible problems with the rotation curve of NGC 3198 in Sect. 4.4, we finally consider the possibility that the true value of a0 for all galaxies is actually at the lower end of our best-fit interval of Sect. 4.1, i.e. a value compatible with the one determined by Bottema et al. (2002). As a matter of fact, a good reason for this is that the Ursa Major (UMa) galaxy group (e.g., Sanders & Verheijen 1998; Gentile 2008) is nowadays thought to be at a distance of 18.6 Mpc (Tully & Pierce 2000), implying a best-fit value of a0 close to the one of Bottema et al. (2002), see e.g. Gentile et al. (2008). To get fits to the rotation curves of UMa galaxies that are as good as those obtained with a0 = 0.9 × 10⁻⁸ cm s-2 with a higher value of the order of a0 = 1.2 × 10⁻⁸ cm s-2, the distance of the group should be smaller, of the order of 15 Mpc (as originally assumed by Sanders & Verheijen 1998). For this reason, we plot in Fig. 6 the fits of the 12 rotation curves using a0 = 0.9 × 10⁻⁸ cm s-2 (and still the simple μ-function and the distance constrained to lie within the error bars of Table 1). As can be seen, the fits still have approximately the same quality, apart from 3 galaxies: NGC 2841 and NGC 2403 have worse fits2, but the quality of the fit of NGC 3198 improves.
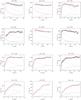 |
Fig. 6 Rotation curve fits with the distance constrained to lie within the error bars of Table 1, and a0 = 0.9 × 10⁻⁸ cm s-2. The lines are described in Fig. 5. |
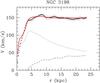 |
Fig. 7 Rotation curve fit of NGC 3198 with a0 = 1.2 × 10⁻⁸ cm s-2 the distance as a free parameter (μ simple d free in Table 2). The distance is 8.6 Mpc and the stellar mass-to-light ratio in the 3.6 μm band is 1.01. The lines are described in Fig. 5. |
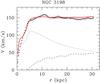 |
Fig. 8 Rotation curve fit of NGC 3198 with a0 = 0.9 × 10⁻⁸ cm s-2, a distance of 11.2 Mpc (see Sect. 4.4), a best-fit stellar M/L ratio in the 3.6μm band of 0.76, and the simple μ function. The lines are described in Fig. 5. |
4.4. NGC 3198
An excellent fit can be found with a0 = 1.2 × 10⁻⁸ cm s-2 by leaving the distance unconstrained. As already noted in previous studies (e.g. Bottema et al. 2002), MOND prefers a smaller distance. Figure 7 shows a very good fit with a distance of 8.6 Mpc, which is significantly lower than the Cepheids-based one of 13.8 Mpc. The distance that one would get by fixing the stellar M/L ratio to the population synthesis value is also lower than the Cepheids value (9.6 Mpc). We note that other methods (the Tully-Fisher distance or the Hubble flow distance, both less accurate than the Cepheids) also yield lower values (see van Albada et al. 1985; and Bottema et al. 2002) than the Cepheids. It is, however, also interesting that the regions where the fit with the distance constrained is most discrepant (roughly, the first and last thirds of the rotation curve) are also those where the amplitude of the non-circular motions is higher, taken from Trachternach et al. (2008) and they are about the same order of magnitude. The increase of the non-circular motions from the middle part of the rotation curve to the outer parts at ~10 km s-1 is also noted in Sellwood & Zánmar Sánchez (2010). The interpretation is further complicated by the fact that the IRAC 3.6 μm image shows what seems to be an end-on bar in the very inner part of NGC 3198. The main spiral arms of NGC 3198 originate here, and it is not clear how these affect the dynamics. The use of two different disks for the stellar contribution (see de Blok et al. 2008) does not significanly change the results. We thus conclude that a full MOND modelling of the two-dimensional velocity field of this galaxy, taking the modified Poisson equation(s) of Bekenstein & Milgrom (1984) or Milgrom (2010) into account, as well as the non-axisymmetry of the galactic potential, would lead to a benchmark test for the viability of MOND as a modification of gravity. We note, however, that a lower value of a0 would improve the fit of NGC 3198 although the fits of NGC 2841 and NGC 2403 would get worse. With a0 = 0.9 × 10⁻⁸ cm s-2, a fit equivalent to the one of Fig. 7 would be obtained for a distance of 10.3 Mpc instead of 8.6 Mpc, closer to the Cepheid-based distance of 13.8 Mpc. Actually, it has been mentioned that there might be a reddening problem in determining the distance. In Macri et al. (2001), the H-band Cepheids distance of NGC 3198 is 11.2 Mpc. Therefore, with a0 = 0.9 × 10⁻⁸ cm s-2, there may be no problem with the rotation curve of NGC 3198 (see Fig. 8).
4.5. Scaling relations
An interesting way to interpret the above MOND results is to phrase them in terms of the usual dark matter framework, considering MOND as a phenomenological, empirical law encompassing the behaviour of dark matter in galaxies. The additional gravity generated by MOND, compared to the Newtonian case, can indeed be attributed to what one would call dark matter in the Newtonian context, and this effective matter is called “phantom dark matter”. For the gravity generated by baryons, we hereafter use the mass-to-light ratios from the fits made with the simple interpolation function and the distance constrained.
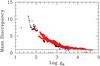 |
Fig. 9 Mass discrepancy-acceleration relation using the rotation curve data of our sample. The gravitational acceleration generated by baryons (gN) is measured in km2 s-2 kpc-1 and they result from the fits made with the simple interpolation function and the distance constrained in Table 2. Black (open) circles represent the data points with an uncertainty above 5%. The data points with an uncertainty below 5% are shown as red (full) circles. |
In Fig. 9, we display the scaling relation known as the mass discrepancy-acceleration relation (McGaugh 2004), showing that the ratio of enclosed total dynamical mass (in Newtonian gravity) with respect to enclosed baryonic mass at any radius is a function of the gravity generated by the baryons at this radius. This relation precisely traces the μ-function of MOND, and the small scatter around the line indicates the deviation from the MOND behaviour, mostly consistent with observational errors.
Then, following Walker et al. (2010), we plot the gravity of (phantom) dark matter as a function of radius for the 12 galaxies of the sample. This is plotted in Fig. 10. Remarkably we find that the additional gravity predicted by MOND is in accordance with the mean and scatter in Fig. 1 of Walker et al. (2010). However, if one plots this additional gravity as a function of the baryonic gravitational acceleration (Fig. 11), the scatter is much lower, and it samples the μ-function. Since the range of “phantom dark matter” gravities is not very broad for the considered range of such gravitational accelerations, it gives the illusion of a dark matter gravity that is more or less constant with radius.
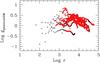 |
Fig. 10 Gravitational acceleration generated by phantom dark matter (gphantomDM, measured in km2 s-2 pc-1) versus radius (in pc). The values of gphantomDM result from the fits made with the simple interpolation function and the distance constrained in Table 2. |
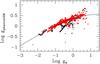 |
Fig. 11 Gravitational acceleration generated by phantom dark matter (gphantomDM) versus gravitational acceleration generated by baryons (gN). The units are km2 s-2 pc-1. The values of gphantomDM and gN result from the fits made with the simple interpolation function and the distance constrained in Table 2. The solid line represents the simple interpolation function of MOND (Eq. (4)) |
5. Conclusion
We re-analysed the ability of the Modified Newtonian Dynamics (MOND; Milgrom 1983) paradigm to fit galaxy rotation curves, using the most up-to-date high-resolution HI data for nearby (d < 15 Mpc) galaxies from the recent THINGS survey (Walter et al. 2008). We selected a subset of 12 galaxies not obviously dominated by non-circular motions and yielding the most reliable mass models.
First, we redetermined the value of the acceleration parameter in MOND (a0), which is unknown a priori but has to be the same for all galaxies. This was done for both commonly used interpolating functions μ of MOND. We find a median value of a0 = (1.27 ± 0.30) × 10-8 cm s-2 for the “standard” μ function (Eq. (3)), and a0 = (1.22 ± 0.33) × 10-8 cm s-2 for the “simple” μ function (Eq. (4)), very close to the value determined in previous studies (e.g. Begeman et al. 1991).
Then, fixing these values for a0, we performed three fits for each μ function: with the distance fixed at the value determined in an independent way, then by leaving the distance free but constrained within the uncertainties of this distance determination, and then with the distance as a free parameter with no constraints (Table 2). We find that the MOND fits with the distance “constrained” are of very good quality (Fig. 5), with three exceptions: two of these are galaxies that cannot give good fits using Newtonian dynamics plus dark matter (NGC 2976 and NGC 7793) either, see de Blok et al. (2008). For the remaining galaxy (NGC 3198), there is indeed some tension between observations and the MOND fit, which might be explained by the presence of non-circular motions, a small distance (see Fig. 7), or a value of a0 at the lower end of our best-fit interval (see Fig. 8). In any case, further observations (constraining the distance) and modelling of NGC 3198 in the MOND context should thus lead to a benchmark test for MOND as a modification of gravity. But we also show that, as an empirical law encompassing the behaviour of the gravitational field on galaxy scales, regardless of its cause, MOND is still very successful and summarizes old and new scaling relations with remarkable consistency (Sect. 4.5).
We also conclude, both from arguments of best-fit stellar mass-to-light ratios (Sect. 4.2) and best-fit distances (Sect. 4.3), that the simple μ-function is preferred over the standard one. As noted by Famaey & Binney (2005) and McGaugh (2008), this is also the case when fitting the terminal velocity curve of our own Milky Way galaxy. Angus et al. (2010) also reached the same conclusion from using temperature profiles of the X-ray emitting gas of a sample of clusters, and from assuming that dark matter in MONDian galaxy clusters is made of 11eV fermionic particles3.
We do note, however, that, in order to constrain μ from galaxy rotation curves within the modified gravity framework of MOND (see Sect. 2), one should actually calculate predictions of the modified Poisson formulations of Bekenstein & Milgrom (1984) or Milgrom (2010) numerically for each galaxy model and for each choice of parameters. Our present conclusion for THINGS galaxy rotation curves holds only for the modified inertia formulation for circular orbits given here by Eq. (1).
In de Blok et al. (2008), the velocity difference between the approaching and receding sides was considered in the error budget of each point of the rotation curve. In many cases this results in errorbars that are larger than the point-to-point scatter, which implies that the χ2 values cannot be used as probability indicators.
In this case the less well fitted galaxy would be NGC 2403. Possible effects could be that the r, J, H and K photometric profiles have a different shape from the 3.6 μm band (see Kent 1987; Fraternali et al. 2002; de Blok et al. 2008). In addition, Fig. 7 of de Blok et al. (2008) shows that the outer parts of the rotation curve are quite uncertain. In that paper, the stellar component is also modelled with two separate components. Using two different disks for the stellar contribution does not change the results significantly.
Acknowledgments
G.G. is a postdoctoral researcher of the FWO-Vlaanderen (Belgium). B.F. is a CNRS Senior Resarch Associate (France) and acknowledges the support of the AvH foundation (Germany). The work of W.J.G.d.B. is based upon research supported by the South African Research Chairs Initiative of the Department of Science and Technology and National Research Foundation. We acknowledge the usage of the HyperLeda database (http://leda.univ-lyon1.fr). We are grateful to the whole THINGS (The HI Nearby Galaxy Survey) team, and in particular to Fabian Walter and Elias Brinks for valuable suggestions. We also wish to thank Garry Angus for very useful comments on the paper. Finally, we thank the referee, Bob Sanders, for valuable comments that improved the quality and scientific content of this paper.
References
- Angus, G. W., Shan, H. Y., Zhao, H. S., & Famaey, B. 2007, ApJ, 654, L13 [NASA ADS] [CrossRef] [Google Scholar]
- Angus, G. W., Famaey, B., & Diaferio, A. 2010, MNRAS, 402, 395 [NASA ADS] [CrossRef] [Google Scholar]
- Begeman, K. G., Broeils, A. H., & Sanders, R. H. 1991, MNRAS, 249, 523 [NASA ADS] [CrossRef] [Google Scholar]
- Bekenstein, J., & Milgrom, M. 1984, ApJ, 286, 7 [NASA ADS] [CrossRef] [Google Scholar]
- Bekenstein, J. D. 2004, Phys. Rev. D, 70, 083509 [NASA ADS] [CrossRef] [Google Scholar]
- Bell, E. F., & de Jong, R. S. 2001, ApJ, 550, 212 [NASA ADS] [CrossRef] [Google Scholar]
- Bertone, G., Hooper, D., & Silk, J. 2005, Phys. Rep., 405, 279 [NASA ADS] [CrossRef] [Google Scholar]
- Bienaymé, O., Famaey, B., Wu, X., Zhao, H. S., & Aubert, D. 2009, A&A, 500, 801 [NASA ADS] [CrossRef] [EDP Sciences] [Google Scholar]
- Blanchet, L., & Le Tiec, A. 2008, Phys. Rev. D, 78, 024031 [NASA ADS] [CrossRef] [Google Scholar]
- Bottema, R., Pestaña, J. L. G., Rothberg, B., & Sanders, R. H. 2002, A&A, 393, 453 [NASA ADS] [CrossRef] [EDP Sciences] [Google Scholar]
- Brada, R., & Milgrom, M. 1995, MNRAS, 276, 453 [Google Scholar]
- Bruneton, J.-P., & Esposito-Farèse, G. 2007, Phys. Rev. D, 76, 124012 [NASA ADS] [CrossRef] [Google Scholar]
- de Blok, W. J. G., & McGaugh, S. S. 1998, ApJ, 508, 132 [NASA ADS] [CrossRef] [Google Scholar]
- de Blok, W. J. G., Walter, F., Brinks, E., et al. 2008, AJ, 136, 2648 [NASA ADS] [CrossRef] [Google Scholar]
- Donato, F., Gentile, G., Salucci, P., et al. 2009, MNRAS, 397, 1169 [NASA ADS] [CrossRef] [Google Scholar]
- Drozdovsky, I. O., & Karachentsev, I. D. 2000, A&AS, 142, 425 [Google Scholar]
- Famaey, B., & Binney, J. 2005, MNRAS, 363, 603 [NASA ADS] [CrossRef] [Google Scholar]
- Famaey, B., Gentile, G., Bruneton, J.-P., & Zhao, H. 2007, Phys. Rev. D, 75, 063002 [NASA ADS] [CrossRef] [Google Scholar]
- Famaey, B., & Bruneton, J.-P. 2010, Dark Matter in Astrophysics and Particle Physics, Dark 2009, Proceedings of the 7th International Heidelberg Conference, Christchurch, New Zealand, 18–24 January 2009, ed. H. V. Klapdor-Kleingrothaus, & I. V. Krivosheina (Singapore, Hackensack NJ: World Scientific), 335 [arXiv:0906.0578] [Google Scholar]
- Ferreira P., & Starkman, G. 2009, Science, 326, 812 [NASA ADS] [CrossRef] [PubMed] [Google Scholar]
- Ferreras, I., Mavromatos, N., Sakellariadou, M., & Yusaf, M. 2009, Phys. Rev. D, 80, 103506 [NASA ADS] [CrossRef] [Google Scholar]
- Fraternali, F., van Moorsel, G., Sancisi, R., & Oosterloo, T. 2002, AJ, 123, 3124 [NASA ADS] [CrossRef] [Google Scholar]
- Freedman, W. L., Madore, B. F., Gibson, B. K., et al. 2001, ApJ, 553, 47 [NASA ADS] [CrossRef] [Google Scholar]
- Gentile, G., Famaey, B., Combes, F., et al. 2007, A&A, 472, L25 [NASA ADS] [CrossRef] [EDP Sciences] [Google Scholar]
- Gentile, G., Zhao, H. S., & Famaey, B. 2008, MNRAS, 385, L68 [NASA ADS] [Google Scholar]
- Gentile, G., Famaey, B., Zhao, H., & Salucci, P. 2009, Nature, 461, 627 [NASA ADS] [CrossRef] [PubMed] [Google Scholar]
- Halle, A., Zhao, H., & Li, B. 2008, ApJS, 177, 1 [NASA ADS] [CrossRef] [Google Scholar]
- Hughes, S. M. G., Han, M., Hoessel, J., et al. 1998, ApJ, 501, 32 [NASA ADS] [CrossRef] [Google Scholar]
- Karachentsev, I. D., Dolphin, A. E., Geisler, D., et al. 2002, A&A, 383, 125 [NASA ADS] [CrossRef] [EDP Sciences] [Google Scholar]
- Karachentsev, I. D., Karachentseva, V. E., Huchtmeier, W. K., & Makarov, D. I. 2004, AJ, 127, 2031 [Google Scholar]
- Kent, S. M. 1987, AJ, 93, 816 [NASA ADS] [CrossRef] [Google Scholar]
- Kelson, D. D., Illingworth, G. D., Saha, A., et al. 1999, ApJ, 514, 614 [NASA ADS] [CrossRef] [Google Scholar]
- Leroy, A. K., Walter, F., Bigiel, F., et al. 2009, AJ, 137, 4670 [NASA ADS] [CrossRef] [Google Scholar]
- Li, H.-N., Wu, H., Cao, C., & Zhu, Y.-N. 2007, AJ, 134, 1315 [NASA ADS] [CrossRef] [Google Scholar]
- Macri, L. M., Stetson, P. B., Bothun, G. D., et al. 2001, ApJ, 559, 243 [NASA ADS] [CrossRef] [Google Scholar]
- McGaugh, S. S., & de Blok, W. J. G. 1998, ApJ, 499, 41 [NASA ADS] [CrossRef] [Google Scholar]
- McGaugh, S. S. 2004, ApJ, 609, 652 [NASA ADS] [CrossRef] [Google Scholar]
- McGaugh, S. S. 2005, ApJ, 632, 859 [NASA ADS] [CrossRef] [Google Scholar]
- McGaugh, S. S. 2008, ApJ, 683, 137 [NASA ADS] [CrossRef] [Google Scholar]
- Milgrom, M. 1983, ApJ, 270, 365 [NASA ADS] [CrossRef] [Google Scholar]
- Milgrom, M. 1994, Ann. Phys., 229, 384 [NASA ADS] [CrossRef] [Google Scholar]
- Milgrom, M. 2008, [arXiv:0801.3133] [Google Scholar]
- Milgrom, M. 2009, MNRAS, 399, 474 [NASA ADS] [CrossRef] [Google Scholar]
- Milgrom, M. 2010, MNRAS, 403, 886 [NASA ADS] [CrossRef] [Google Scholar]
- Milgrom, M., & Sanders, R. H. 2008, ApJ, 678, 131 [NASA ADS] [CrossRef] [Google Scholar]
- Müller, J. W. 2000, J. Res. Natl. Inst. Stand. Technol, 105, 551 [PubMed] [Google Scholar]
- Pahre, M. A., Ashby, M. L. N., Fazio, G. G., & Willner, S. P. 2004, ApJS, 154, 229 [NASA ADS] [CrossRef] [Google Scholar]
- Paturel G., Petit C., Prugniel P., et al. 2003, A&A, 412, 45 [NASA ADS] [CrossRef] [EDP Sciences] [Google Scholar]
- Rawson, D. M., Macri, L. M., Mould, J. R., et al. 1997, ApJ, 490, 517 [NASA ADS] [CrossRef] [Google Scholar]
- Sanders, R. H. 2005, MNRAS, 363, 459 [NASA ADS] [Google Scholar]
- Sanders, R. H., & Verheijen, M. A. W. 1998, ApJ, 503, 97 [NASA ADS] [CrossRef] [Google Scholar]
- Sanders, R. H., & McGaugh, S. S. 2002, ARA&A, 40, 263 [NASA ADS] [CrossRef] [Google Scholar]
- Sanders, R. H., & Noordermeer, E. 2007, MNRAS, 379, 702 [NASA ADS] [CrossRef] [Google Scholar]
- Sellwood, J., & Zanmar Sanchez, R. 2010, MNRAS, 404, 1733 [NASA ADS] [Google Scholar]
- Shan, H. Y., Feix, M., Famaey, B., & Zhao, H. 2008, MNRAS, 387, 1303 [NASA ADS] [CrossRef] [Google Scholar]
- Skordis, C. 2009, Classical and Quantum Gravity, 26, 143001 [Google Scholar]
- Skordis, C., Mota, D. F., Ferreira, P. G., & Bœhm, C. 2006, Phys. Rev. Lett., 96, 011301 [NASA ADS] [CrossRef] [PubMed] [Google Scholar]
- Swaters, R. A., Sanders, R. H., & McGaugh, S. S. 2010, ApJ, 718, 380 [NASA ADS] [CrossRef] [Google Scholar]
- Tian, L., Hoekstra, H., & Zhao, H.S. 2009, MNRAS, 393, 885 [NASA ADS] [CrossRef] [Google Scholar]
- Tiret, O., & Combes, F. 2008, ASP Conf. Ser., 396, 259 [Google Scholar]
- Trachternach, C., de Blok, W. J. G., Walter, F., Brinks, E., & Kennicutt, R. C. 2008, AJ, 136, 2720 [NASA ADS] [CrossRef] [Google Scholar]
- Tully, R. B., & Pierce, M. J. 2000, ApJ, 533, 744 [NASA ADS] [CrossRef] [Google Scholar]
- van Albada, T. S., Bahcall, J. N., Begeman, K., & Sancisi, R. 1985, ApJ, 295, 305 [NASA ADS] [CrossRef] [Google Scholar]
- Vinkó, J., Takáts, K., Sárneczky, K., et al. 2006, MNRAS, 369, 1780 [NASA ADS] [CrossRef] [Google Scholar]
- Walker, M., McGaugh, S., Mateo, M., Olszewski, E., & Kuzio de Naray, R. 2010, ApJ, 717, L87 [NASA ADS] [CrossRef] [Google Scholar]
- Walter, F., Brinks, E., de Blok, W. J. G., et al. 2008, AJ, 136, 2563 [NASA ADS] [CrossRef] [Google Scholar]
- Zhao, H. S., & Famaey, B. 2006, ApJ, 638, L9 [NASA ADS] [CrossRef] [Google Scholar]
- Zhao, H. S., & Famaey, B. 2010, Phys. Rev. D., 81, 087304 [NASA ADS] [CrossRef] [Google Scholar]
- Zhu, Y.-N., Wu, H., Li, H.-N., & Cao, C. 2010, Res. Astron. Astrophys., 10, 329 [NASA ADS] [CrossRef] [Google Scholar]
- Zlosnik, T. G., Ferreira, P. G., & Starkman, G. D. 2007, Phys. Rev. D, 75, 044017 [NASA ADS] [CrossRef] [Google Scholar]
All Tables
All Figures
|
Fig. 1 The interpolating μ-functions of Eq. (3) (standard, dashed line) and Eq. (4) (simple, dotted line) are displayed as a function of x = g/a0. An improved simple function (solid line) interpolating between simple and standard for x ≳ 10 is also presented to show that a transition behaviour governed by the simple μ-function in galaxies (where x < 10) can a priori be in accordance with the Solar System constraints (where x ≫ 10). |
| In the text | |
|
Fig. 2 Best-fit a0 values (using the simple interpolating function) vs. central surface brightness in the 3.6 μm band. |
| In the text | |
|
Fig. 3 Stellar M/L ratio in the 3.6 μm band vs. (J − K) colour. The full circles are the results of the MOND fits (using the simple μ-function of Eq. (4) and a0 = 1.22 × 10⁻⁸ cm s-2) with the distance constrained within the uncertainties of its independently determined value, whereas the solid line represents the predictions of stellar population synthesis models (see text for details). |
| In the text | |
|
Fig. 4 Stellar M/L ratio in the B band vs. (B − V) colour. See Fig. 3 for the explanation of line and symbols. |
| In the text | |
|
Fig. 5 Rotation curve fits with the distance “constrained” and a0 = 1.22 × 10⁻⁸ (μ simple d constr. in Table 2). Dashed, dotted, and long-dashed lines represent the Newtonian contributions of the gaseous disk, stellar disk, and bulge, respectively. The MOND best-fit model is shown as a solid red line. |
| In the text | |
|
Fig. 6 Rotation curve fits with the distance constrained to lie within the error bars of Table 1, and a0 = 0.9 × 10⁻⁸ cm s-2. The lines are described in Fig. 5. |
| In the text | |
|
Fig. 7 Rotation curve fit of NGC 3198 with a0 = 1.2 × 10⁻⁸ cm s-2 the distance as a free parameter (μ simple d free in Table 2). The distance is 8.6 Mpc and the stellar mass-to-light ratio in the 3.6 μm band is 1.01. The lines are described in Fig. 5. |
| In the text | |
|
Fig. 8 Rotation curve fit of NGC 3198 with a0 = 0.9 × 10⁻⁸ cm s-2, a distance of 11.2 Mpc (see Sect. 4.4), a best-fit stellar M/L ratio in the 3.6μm band of 0.76, and the simple μ function. The lines are described in Fig. 5. |
| In the text | |
|
Fig. 9 Mass discrepancy-acceleration relation using the rotation curve data of our sample. The gravitational acceleration generated by baryons (gN) is measured in km2 s-2 kpc-1 and they result from the fits made with the simple interpolation function and the distance constrained in Table 2. Black (open) circles represent the data points with an uncertainty above 5%. The data points with an uncertainty below 5% are shown as red (full) circles. |
| In the text | |
|
Fig. 10 Gravitational acceleration generated by phantom dark matter (gphantomDM, measured in km2 s-2 pc-1) versus radius (in pc). The values of gphantomDM result from the fits made with the simple interpolation function and the distance constrained in Table 2. |
| In the text | |
|
Fig. 11 Gravitational acceleration generated by phantom dark matter (gphantomDM) versus gravitational acceleration generated by baryons (gN). The units are km2 s-2 pc-1. The values of gphantomDM and gN result from the fits made with the simple interpolation function and the distance constrained in Table 2. The solid line represents the simple interpolation function of MOND (Eq. (4)) |
| In the text | |
Current usage metrics show cumulative count of Article Views (full-text article views including HTML views, PDF and ePub downloads, according to the available data) and Abstracts Views on Vision4Press platform.
Data correspond to usage on the plateform after 2015. The current usage metrics is available 48-96 hours after online publication and is updated daily on week days.
Initial download of the metrics may take a while.