Fig. 9
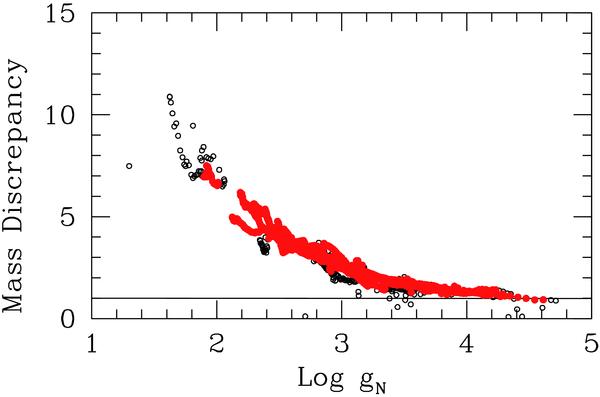
Mass discrepancy-acceleration relation using the rotation curve data of our sample. The gravitational acceleration generated by baryons (gN) is measured in km2 s-2 kpc-1 and they result from the fits made with the simple interpolation function and the distance constrained in Table 2. Black (open) circles represent the data points with an uncertainty above 5%. The data points with an uncertainty below 5% are shown as red (full) circles.
Current usage metrics show cumulative count of Article Views (full-text article views including HTML views, PDF and ePub downloads, according to the available data) and Abstracts Views on Vision4Press platform.
Data correspond to usage on the plateform after 2015. The current usage metrics is available 48-96 hours after online publication and is updated daily on week days.
Initial download of the metrics may take a while.